Article Contents
Those working in finance or trading will eventually encounter the untimely question from one of their friends, family members, acquaintances, or even strangers: how can they invest in the markets. They either ask what stock to buy or what broker to choose, some even ask pointed questions about a particular stock they heard about on the news. But eventually somebody always asks: how much should I begin investing with?
I wish there was a simple enough answer, nobody wants to hear “well, it depends” and they definitely don’t want to hear thousands of dollars. Conversely, you will also hear responses such as “only the amount you’re prepared to lose” – which isn’t the wisest approach either.
Together we will try to debunk the myth of minimum capital requirements for investing, and how to take advantage of Morpher's fractional trading capabilities. Fractional Trading is buying or selling a security with capital that is less than or not equal to a whole unit (share) of the underlying asset.
“How much do I need to start investing?”
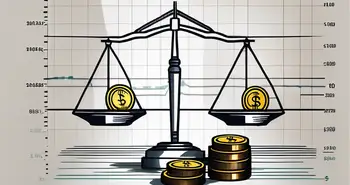
One of the reasons proprietary trading shops (professionally trading your own capital with leverage) exist is the high share price of regular stocks. Let's walk through a potential investment thesis: you the investor wants to commit capital to the FAANG stocks.
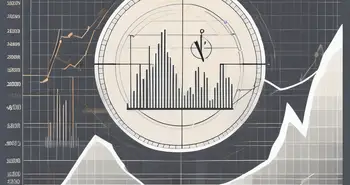
The FAANG stocks are some of the most popular stocks among Wall Street’s investors. The group is composed of Facebook ($187), Amazon ($1,883), Apple ($213), Netflix ($290), and Alphabet ($1,206) – amicably named FAANG by CNBC’s Jim Cramer. On the most basic level, owning just one share of each FAANG company today would require an initial capital requirement of $3,708. The chart below represents the portfolio distribution of those five stocks.

This is the allocation if an investor simply wants a piece of the action. They have heard of these stocks on the news, and they are comfortable investing in stocks that make products they use everyday. What happens if you don't want 50% of your portfolio to be exposed to Amazon? You need a lot more than that initial $3,708.
You need to spend over $3,700 just to invest in the 5 most popular tech stocks.
Let's use the portfolio visualizer tool to back-test the monthly re-balanced portfolio, and we can calibrate weights with the optimizer later.
If this portfolio was created in June 2012 (first full trading month of Facebook) then it would have had a compounded annual growth rate of 27.74%. Not too shabby, considering you would have only have needed $612 back then. However, just buying 1 share of each stock is not a great approach, we can improve on this.
High stock market returns are great, but that's not the same as investment skill and you still need risk management. People can beat the market every year, doing it consistently without the risk of losing it all is the challenge. The most basic method investors employ to mitigate risk is diversification. By spreading their capital between lots of different stocks, investors reduce their exposure to idiosyncratic risks of a single company.
Let’s change our capital distribution and create an equally weighted portfolio. In this distribution, each of the FAANG stocks gets 20% of our funds. An equally weighted portfolio actually outperformed the single share portfolio with a CAGR of 35.65% and a 912% total return. However, you would now need over $7,200 to even create this portfolio.
| Symbol | Price June 2012 ($) | Shares | Return % | Value |
| FB | 29 | 49 | 19.7% | $ 1,421 |
| AMZN | 208 | 7 | 20.2% | $ 1,456 |
| AAPL | 81 | 18 | 20.3% | $ 1,458 |
| NFLX | 8 | 179 | 19.9% | $ 1,432 |
| GOOGL | 286 | 5 | 19.9% | $ 1,430 |
| $ 7,197 |
We still haven’t considered any proper optimization or real risk management practices. Taking into consideration portfolio choice theories and generally accepted portfolio models, we now need to optimize this portfolio so that it fits the highest risk-adjusted return profile possible. We do this by maximizing the Sharpe ratio – which takes into account the excess return achieved outside the scope of undertaking further risk.
When we balance the weights of this portfolio in order to maximize the Sharpe ratio, we get only slightly different weighting results. It boasts a remarkable total return of 1,070%, and a CAGR of 38.69%.
Presented below are all three portfolios:
| Metric | Single-Share Portfolio | Maximum Sharpe Ratio | Equal Weighted |
| CAGR | 27.10% | 38.69% | 35.65% |
| Expected Return | 29.39% | 42.26% | 38.66% |
| Stdev | 19.46% | 23.45% | 21.69% |
| Best Year | 60.69% | 111.71% | 97.87% |
| Worst Year | -3.70% | 4.32% | 7.36% |
| Sharpe Ratio (ex-ante) | 1.48 | 1.78 | 1.75 |
| Sharpe Ratio (ex-post) | 1.31 | 1.5 | 1.5 |
| Sortino Ratio | 2.62 | 3.28 | 3.22 |
| US Stock Market Correlation | 0.68 | 0.59 | 0.62 |
Ex-post = using realized historical returns
Ex-ante = using expected return.
Fractional Trading and the Perfect Portfolio
Comparing the various portfolio allocations underlines the importance of optimization. You need a system in place to adjust the portfolio balance periodically. Up until now managing a personal investment portfolio was difficult because of the variability of prices. There shouldn’t have to be a price tag on perfect allocation, or basic forms of risk management. The ability to invest fractionally – or any amount you want – allows anyone to achieve risk-adjusted portfolios.
When the barrier to entry for investing is so low, it opens up the doors to experimentation. With $100 you could be running five portfolios and five different strategies. You would also be able to construct your own ETFs by investing fractional amounts across different assets. This finally lets us build the perfectly allocated portfolio no matter the size of your bank account.
When you’re setting up your portfolio you must take into account the risk-reward tradeoff. In trading and investing a higher potential return usually comes with higher risk. While everyone desires higher returns, their expected return is limited by the amount of risk that they are willing to bear. This is defined by your risk aversion, and there are many tests you can take that determine how risk averse you are.
Once you understand your risk aversion then you are ready to create a protocol for your own portfolio. A common way of managing risk is by limiting the weight of certain groups of assets in your portfolio, as certain classes lend themselves to more volatility.
Types of Assets by Risk:
The list below is sorted so that the riskiest (most volatile assets) appear at the top of the list, and the least volatile asset classes are on the bottom.
- Emerging Market Equities: Foreign company stock from developing nations. Emerging markets are not as efficient as traditional Western markets. Spreads are higher, and there is an overall lack of liquidity in the market making it difficult to enter and exit positions. Additionally, reporting standards vary between countries, and a lot of price action may completely surprise you. At the same time, most investors remain so cautious of EM assets that many companies trade at bargain valuations and have a great potential for outsized returns.
- Small-cap stocks: Companies with market caps below 2 bn USD. With less liquidity comes higher volatility, even in Western markets. A smaller company may also be hindered by it’s own scale; the product pipeline may be shallow, manufacturing operations dependent on a limited amount of suppliers, or a key individual in the company makes most critical decisions. Identifying a small-cap stock that may one day grow to be the next Google or Apple is the dream of every investor, how much risk you are able to tolerate is the deciding factor.
- International Equities: Foreign company stock. There are certainly many large-cap companies that are located outside of Western markets. The UK, Germany, France, and Switzerland all host some of the worlds largest publicly trading companies, however nothing compares to the liquidity profile of the US stock market. Investors must also take into account the varying affects of global macroeconomic policy.
- Mid-cap stocks: Companies with market caps between 2 and 10 bn USD. While these companies are not yet Blue Chip, they’ve already gained the attention of institutional buyers and exhibit much less volatility than small-caps. These companies mostly employ expansionary policies, and may engage in a lot of M&A activities that influence investor sentiment.
- Large-cap stocks: Companies with market caps exceeding 10 bn USD. These companies are well into the maturity phase of the business lifecycle. There is little that moves these companies on a fundamental level, and nothing that can surprise investors. While performance will vary quarter-to-quarter, these companies are careful in issuing guidance to investors insofar as revenue expectations. There is ample liquidity in the market, and the price is mainly swayed by the sentiment of large investors representing pension, insurance, and mutual funds.
- Real-estate investment trusts (REITS): Shares of funds managing real-estate investments. This represents a great alternative to investing in real-estate directly. Investors are able to invest in real-estate selectively based off the strategies employed by the fund managers. However, real-estate prices also lend themselves to a bit of volatility. At the same time this asset class represents securities where there is an associated utility and numismatic value in the underlying market – making it a little more suitable for risk averse investors.
- Fixed Income Securities: Corporate and sovereign bonds. Corporate bonds are issues by companies that need to borrow money to fund expansion, product development, and research. These are riskier because the borrower is still subject to insolvency. The upside is that debtors always have liquidation preference over stock holders, so if the company goes bankrupt you may get your money back (eventually). Sovereign (government) bonds are often considered risk-free by many investors. The only way a government bond can become worthless is if the government declares insolvency and defaults on their national debt.
- Money market: Foreign currencies and investments in short-term debt. When you keep your money in cash you are subjecting yourself to inflation. However, in the money market you can also find very low-yielding cash investment securities such as treasury bills. These will give you an anti-inflationary return, but not much more.
Morpher's fractional trading allow users to create diverse, uniquely weighted portfolios with no minimum requirement.
You don't need thousands of dollars to effectively manage a portfolio. Users are finally able to trade an asset with just $1; creating their perfect allocations, or effectively creating their own weighted renditions of indices. For the first time, financial markets are accessible by everyone.

Disclaimer: All investments involve risk, and the past performance of a security, industry, sector, market, financial product, trading strategy, or individual’s trading does not guarantee future results or returns. Investors are fully responsible for any investment decisions they make. Such decisions should be based solely on an evaluation of their financial circumstances, investment objectives, risk tolerance, and liquidity needs. This post does not constitute investment advice.

Painless trading for everyone
Hundreds of markets all in one place - Apple, Bitcoin, Gold, Watches, NFTs, Sneakers and so much more.
Painless trading for everyone
Hundreds of markets all in one place - Apple, Bitcoin, Gold, Watches, NFTs, Sneakers and so much more.
Subscribe now to our newsletter to get critical insights and analysis: