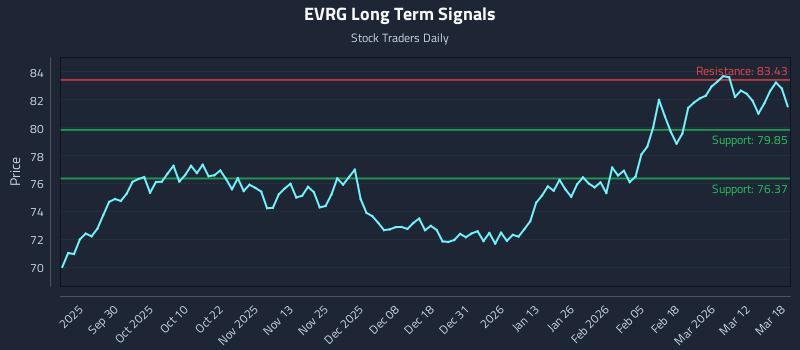
(EVRG) as a Liquidity Pulse for Institutional Tactics
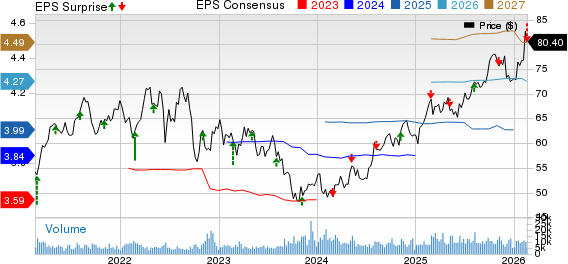
This article provides an in-depth analysis of Evergy Inc. (NASDAQ: EVRG) for institutional tactics, highlighting near-term strong sentiment transitioning to a long-term positive bias. It details three AI-generated trading strategies—Position Trading, Momentum Breakout, and Risk Hedging—along with multi-timeframe signal analysis, and offers real-time signals and risk management parameters.
https://news.stocktradersdaily.com/news_release/8/EVRG_as_a_Liquidity_Pulse_for_Institutional_Tactics_031826054602_1773870362.html