
I've been analyzing market trends for years, and one tool that has consistently helped me make informed investment decisions is the Bullish Percent Index. In this comprehensive guide, I will take you through everything you need to know about this powerful indicator and how you can use it to your own advantage.
What is the Bullish Percent Index?
At its core, the Bullish Percent Index (BPI) is a measure of market sentiment. It provides valuable insights into whether investors are predominantly bullish or bearish. The BPI is calculated based on the percentage of stocks in a given market or sector that are currently exhibiting bullish technical patterns.
The Bullish Percent Index is a powerful tool that investors use to gauge the overall sentiment of the market. By analyzing the percentage of stocks exhibiting bullish technical patterns, we can gain a deeper understanding of investor behavior and market trends. This information allows us to make more informed investment decisions and adjust our strategies accordingly.
When the Bullish Percent Index is high, it indicates that a large number of stocks are showing bullish patterns. This suggests that investors are optimistic about the market and may be more willing to buy stocks.
On the other hand, a low Bullish Percent Index suggests that a significant number of stocks are exhibiting bearish patterns, indicating a more pessimistic sentiment among investors.
The Concept Behind the Bullish Percent Index
The concept of the Bullish Percent Index is grounded in the idea that stock price movements tend to follow specific patterns. These patterns can be identified through technical analysis, which involves studying historical price data and chart patterns. By analyzing these patterns, we can gain insights into market sentiment and predict potential future price movements.
Technical analysts use various indicators and tools to measure market sentiment, and the Bullish Percent Index is one such tool. It provides a simple and straightforward measure of the percentage of stocks exhibiting bullish patterns, allowing investors to quickly assess the overall sentiment of the market.
By understanding the concept behind the Bullish Percent Index, investors can better interpret its readings and use them to their advantage. It is important to note that the Bullish Percent Index should not be used in isolation but should be considered alongside other technical indicators and fundamental analysis to make well-rounded investment decisions.
Combining technical analysis with fundamental analysis is crucial for building a robust trading strategy. Morpher enhances this approach by offering detailed charts powered by TradingView, along with Morpher AI. This AI tool, available for free to all Morpher users, provides real-time market news, ensuring you stay updated with the latest developments. Sign up for Morpher today and start building your perfect trading strategy with the best tools at your fingertips!
The Calculation of the Bullish Percent Index
Calculating the Bullish Percent Index (BPI) involves two key components: understanding point and figure charting and applying the BPI formula. Here's a step-by-step guide to help you understand and calculate the BPI with a detailed case example.
Step 1: Understanding Point and Figure Charting
Point and figure charting is a method used to represent stock price movements visually. Unlike traditional charts, it focuses on significant price changes while ignoring minor fluctuations. This helps in identifying clear bullish and bearish patterns.
Key Patterns in Point and Figure Charting
-
Bullish Patterns:
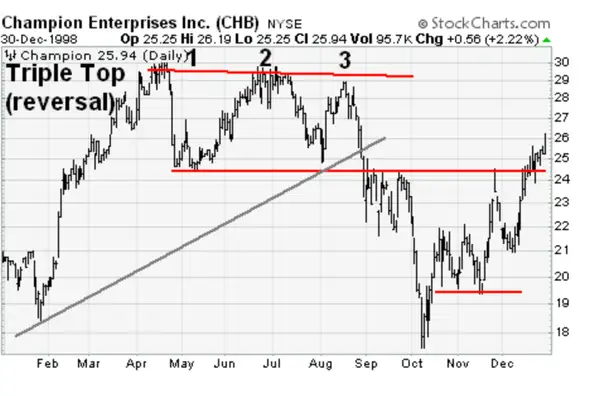
- Ascending Triple Tops: The stock price reaches the same resistance level three times, indicating a potential upward trend.
- Bullish Catapults: A sharp price increase following a period of consolidation, suggesting bullish sentiment.
- Bullish Triangles: The stock price forms higher lows and lower highs, signaling an impending bullish breakout.
-
Bearish Patterns:
- Descending Triple Bottoms: The stock price reaches the same support level three times, indicating a potential downward trend.
- Bearish Catapults: A sharp price decrease after a period of consolidation, suggesting bearish sentiment.
- Bearish Triangles: The stock price forms lower highs and higher lows, indicating an impending bearish breakout.
Step 2: Calculating the Bullish Percent Index
Once you understand the patterns, you can calculate the Bullish Percent Index using the following formula:
BPI = (Number of Bullish Stocks / Total Number of Stocks) × 100
This formula gives the percentage of stocks showing bullish patterns within a specific market or sector.
Case Example: Calculating the BPI for the Technology Sector
Let's go through a detailed example to illustrate how to calculate the BPI.
- Identify the Total Number of Stocks: Suppose the technology sector consists of 100 stocks.
- Count the Bullish Stocks: Out of these 100 stocks, 80 exhibit bullish patterns.
Using the BPI formula:
BPI = (80 / 100) × 100 = 80%
This calculation shows that 80% of the stocks in the technology sector are exhibiting bullish patterns.
Interpreting the Bullish Percent Index
- High BPI: A high BPI (e.g., 80%) indicates a bullish market sentiment, meaning most stocks are showing bullish patterns. Investors might consider buying stocks or increasing market exposure.
- Low BPI: A low BPI suggests a bearish market sentiment, with most stocks showing bearish patterns. Investors might consider exercising caution and possibly reducing market exposure.
Practical Application
By regularly monitoring the BPI, investors can gauge the overall market sentiment and make informed investment decisions. For instance:
- High BPI: If the BPI is high, it suggests a strong market, and it might be a good time to invest in stocks or hold existing positions.
- Low BPI: A low BPI indicates a weaker market, suggesting it might be prudent to be cautious, sell certain positions, or avoid new investments.
The Importance of the Bullish Percent Index in Market Analysis
As an investor, it's crucial to have an accurate gauge of market sentiment. The Bullish Percent Index (BPI) helps us identify periods of extreme optimism or pessimism, allowing us to adjust our strategies accordingly. By staying on top of market trends, we can seize opportunities and mitigate risks.
Market sentiment significantly influences stock prices. When investors are optimistic and bullish, they tend to buy stocks, driving prices higher. Conversely, when they are pessimistic and bearish, they may sell stocks, causing prices to decline.
The BPI provides a quantitative measure of market sentiment, enabling investors to track changes over time. By monitoring the BPI, we can identify potential market turning points and adjust our investment strategies accordingly.
Additionally, the BPI can highlight divergences between market sentiment and actual stock prices. For example, if the BPI shows a high percentage of bullish stocks while the overall market is in a downtrend, this may indicate a potential reversal or a disconnect between sentiment and price action.
Overall, the BPI is a valuable tool in market analysis. It helps us understand investor sentiment, identify potential trends, and make more informed investment decisions. By incorporating the BPI into our analysis, we can navigate the complex world of investing with greater confidence and success.
The Bullish Percent Index and Investment Strategies
Now that we understand how the Bullish Percent Index works, let's explore how we can integrate it into our investment strategies to maximize returns and manage risks.
Using the Bullish Percent Index for Portfolio Management
The Bullish Percent Index is a valuable tool for portfolio management. By regularly monitoring the BPI, we can allocate our investments based on prevailing market sentiment. This ensures that our portfolio aligns with the overall market trend, increasing the probability of success.
The Role of the Bullish Percent Index in Risk Management
Effective risk management is a key component of successful investing. The Bullish Percent Index can help us identify potential market reversals or corrections, allowing us to adjust our positions accordingly. By being proactive and managing risks, we can protect our capital and navigate turbulent market conditions.
Limitations of the Bullish Percent Index
While the Bullish Percent Index is a valuable tool, it's important to recognize its limitations to avoid potential pitfalls.
The Potential Pitfalls of Relying on the Bullish Percent Index
Like any indicator, the Bullish Percent Index is not foolproof. It's crucial to use it alongside other technical and fundamental analysis tools to corroborate findings. Additionally, market sentiment can change rapidly, so it's important to stay vigilant and adapt your strategies accordingly.
The Bullish Percent Index in Different Market Conditions
It's essential to recognize that the effectiveness of the Bullish Percent Index may vary depending on market conditions. In a trending market, the BPI can provide valuable insights. However, during periods of market consolidations or uncertainty, its usefulness may be limited. As an investor, it's crucial to consider the broader market context when interpreting the Bullish Percent Index.
Overall, the Bullish Percent Index is a powerful tool that can give us a clear understanding of market sentiment. By integrating it into our investment strategies and understanding its limitations, we can become more informed and confident investors. Remember, successful investing requires a combination of knowledge, experience, and adaptability.
FAQ
What is the Bullish Percent Index?
The Bullish Percent Index is a measure of market sentiment based on the percentage of stocks exhibiting bullish technical patterns.
How is the Bullish Percent Index calculated?
The Bullish Percent Index is calculated by dividing the number of stocks exhibiting bullish patterns by the total number of stocks in a particular market or sector, then multiplying the result by 100.
How can I interpret the Bullish Percent Index?
A high Bullish Percent Index indicates excessive bullishness, while a low value suggests pessimism. By tracking the BPI over time and analyzing charts, you can identify trends and potential opportunities.
Should I solely rely on the Bullish Percent Index for investment decisions?
While the Bullish Percent Index is a valuable tool, it's important to use it alongside other technical and fundamental analysis tools. Additionally, market conditions can influence the effectiveness of the BPI, so consider the broader context when interpreting its signals.
How can the Bullish Percent Index help with risk management?
The Bullish Percent Index can help identify potential market reversals or corrections, allowing you to adjust your positions accordingly. By being proactive and managing risks, you can protect your capital and navigate uncertain market conditions.
Ready to take your market analysis to the next level with the Bullish Percent Index? Discover the future of trading with Morpher, the innovative platform that's changing the game. With zero fees, infinite liquidity, and the ability to trade across multiple asset classes, Morpher empowers you to act on your insights with precision and flexibility. Whether you're looking to invest fractionally, short sell without interest fees, or leverage up to 10x, Morpher has you covered. Plus, with the Morpher Wallet, you maintain complete control over your investments. Sign up now to experience a unique trading experience on the Ethereum Blockchain and receive your Free Sign Up Bonus. Don't just follow the market trends—shape them with Morpher.

Disclaimer: All investments involve risk, and the past performance of a security, industry, sector, market, financial product, trading strategy, or individual’s trading does not guarantee future results or returns. Investors are fully responsible for any investment decisions they make. Such decisions should be based solely on an evaluation of their financial circumstances, investment objectives, risk tolerance, and liquidity needs. This post does not constitute investment advice.

Painless trading for everyone
Hundreds of markets all in one place - Apple, Bitcoin, Gold, Watches, NFTs, Sneakers and so much more.
Painless trading for everyone
Hundreds of markets all in one place - Apple, Bitcoin, Gold, Watches, NFTs, Sneakers and so much more.