
Volatile cryptocurrency markets move up and down like a roller coaster. However, much like a roller coaster, these markets are predictable since their movements are cyclical. So, to get ahead in the investing game, the importance of having an understanding of these market cycles cannot be overemphasized.
A crypto market cycle comprises a number of phases or patterns. There is no definite time period for such market cycles, some cycles may last just a few months, while others may last years. Pricing peaks and troughs during these phases can be influenced by a host of external factors, such as market sentiment, global events, crypto adoption, and regulatory issues.
This article describes the various phases of cryptocurrency market cycles, how they are identified, and how to profit from trading within these cycles. A sample Bitcoin pricing chart is used to illustrate these phases. Factors affecting cyclical crypto price movements are also summarized.
Understanding Crypto Market Cycles
Crypto market cycles include four (4) primary phases. There is no per se starting point to these cycles. They can begin or end with any one of these phases.
Crypto market phases are characterized by two basic metrics. First, the market pricing activity, that is the buying and selling of the cryptocurrency. Second, the overall trading sentiment driving marketplace participation.
The Accumulation Phase
The accumulation phase typically follows a bear market phase. During the accumulation phase, a bullish trading contingent begins “accumulating” what they believe are distressed assets and prices begin a slight upward trend.
During this phase, buyers start taking control of the market. These buyers are often crypto insiders, those possessing good information, and traders that have experienced several cycles.
Another buying group might include contrarians or bargain hunters looking for new or undervalued assets who are content on holding – HODLing – a depressed asset since they believe in the asset's fundamental value.
Trading activity during this phase is moderate, and prices slightly increase as confidence in the market grows. The overall market value stays the same, but much of the asset is “accumulated” by a small group of traders – hence the name “accumulation” phase.
For example, Figure 1 illustrates four phases of a Bitcoin market cycle, including an initial accumulation phase.
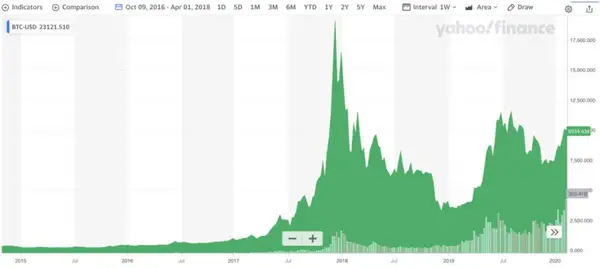
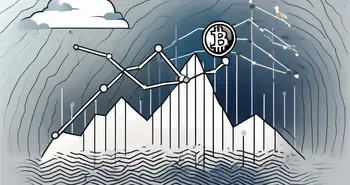
Bitcoin Price Chart
Starting in 2015, Bitcoin prices remained essentially flat up until about May of 2017 and traded between a price range of about $300 to $600. This is consistent with most accumulation phases where an asset will trade between a given price range.
Bitcoin price appreciation begins to accelerate in mid-2017 and this appreciation transitioned to the next phase in the cycle: the markup phase.
The Markup Phase
A markup phase is characterized by a price action that trends upward over a long period of time, typically one to two years. During this phase, the buyer’s market sentiment is greater than the seller’s sentiment, and therefore the crypto value increases. A bull market is starting to emerge.
Rising prices attract greater interest from new investing participants with emotions trending positive. Indeed, markups are typically influenced by new traders’ FOMO (Fear Of Missing Out) and greed. Traders use the Fear & Greed Index to gauge these types of emotions.
For example, the Fear & Greed Index gauges the general crypto market sentiment at a specific moment in time and is represented by a number that ranges from 1 to 100. A “1” represents extreme market fear (investors are selling) and a “100” represents extreme market greed (investors are buying).
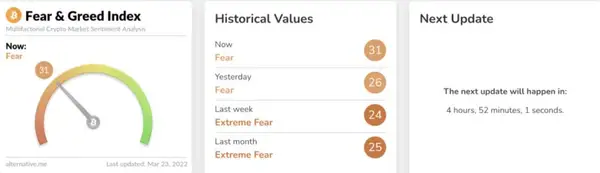
Fear & Greed Index
When the index value is near the “Fear” level, this represents a buying opportunity. There is a certain “Fear” in the marketplace, meaning that investors are afraid of buying at this time. Therefore, the price might be lower as investors sell over fears that crypto is going to lose value.
On the other hand, if the index value is near the higher “Greed” level, this would generally be interpreted as a selling opportunity.
“Greed” or positive market sentiment peaks during the markup phase, with many traders being optimistic about the future. Consequently, prices frequently hit all-time highs (ATHs) during this phase.
And this is what happened to Bitcoin as illustrated in Figure 1. Bitcoin experienced initial pricing of around $430 at the start of the markup phase (mid-2016). From there, Bitcoin went on a bull run for the next eighteen months, eventually reaching an all-time high (ATH) in December 2017.
Once Bitcoin achieved its ATH (i.e., the bull market end), the Fear & Greed Index turned into extreme “Fear” with prices beginning to drop quickly. And this is where Bitcoin’s price action transitions to the next phase in the market cycle: the distribution phase.
The Distribution Phase
Stark price volatility is one clue that can designate the height of the markup phase and where this phase transitions to the distribution phase. This is where greed transitions to fear as the demand becomes exhausted at high prices. Seasoned traders continue to harvest profits.
Sellers eventually become more aggressive, sending the price downwards. Many start liquidating their positions in preparation for an upcoming bear market, due in part to FOMO regarding capturing profits.
However, simultaneously, there are more optimistic market participants who believe that the bull market is ongoing, and are looking to keep buying, or at least HODL.
This creates tension between the buyers and the sellers. Drastic price fluctuations will occur, but within a fairly constant range, since sentiment is split across fear and greed amongst these two different groups.
Eventually, the market sentiment becomes more negative, creating the basis for referring to these activities as a distribution phase: profits are “distributed” to the sellers, who outnumber the buyers.
Indeed, this is what happened in 2017 when Bitcoin’s market cycle transitioned from a late 2017 bull market to a 2018 bear market. As illustrated, Bitcoin experienced drastic price swings during this phase from its ATH to an almost 50% subsequent drop in price, experiencing various pricing peaks and troughs along the way.
The Markdown Phase
The markdown phase is the fourth phase of the crypto market cycle. Applying the Fear and Greed Index, this phase is represented by high levels of fear and low levels of greed, representing a lack of buying interest and a lack of new market capital infusion.
This sell-off can lead to a sharp decline in prices, hence the name markdown phase: prices being marked down. Prices eventually stabilize in the long term wherein optimistic new buyers enter the market and begin to accumulate assets. And the cycle begins anew.
Returning to Figure 1, the Bitcoin mark-down phase is represented where its price action continued its downtrend during early 2018. But then Bitcoin bounces back during the first quarter of 2019 where pricing gains momentum. It is now cycling back to a new accumulation phase.
Factors that Influence Crypto Market Cycles
A few of the more prevalent factors influencing the phases making up crypto market cycles are summarized below.
Adoption and Cryptocurrency Usage Rates
Blockchain adoption and increased cryptocurrency usage rates greatly influence the ebbs and flows of crypto market cycles. As more and more people gain an understanding of the applicability of blockchain technologies, this will help drive acceptance with new technological applications continuing to emerge.
For example, developing use cases such as in financial institutions can bring access to such services without the reliance upon centralized banking platforms. Blockchain can also solve financial institutional challenges such as privacy concerns, inefficient asset transfers, escalating transaction fees, and human errors.
Geopolitical Tensions and Economic Sanctions
Cryptocurrencies are extremely volatile. And global economic and political events greatly affect how these assets transition through their market cycles.
For example, the Russian invasion of Ukraine had an immediate impact on cryptocurrency markets. Shortly after this invasion, the crypto market experienced an immediate 10% downturn. However, after this initial pricing setback, cryptocurrencies clawed back much of these losses.
There are two primary reasons for this clawback. First, the Ukrainian government appealed to the crypto community to donate to its cause against this invasion. And the crypto community was quick to respond with Ukraine already receiving over $100 million in cryptocurrency donations.
Second, this conflict has been responsible for increased global inflation. As inflation continues to heat up, many are fearing the apparent weakness within national banking systems. Trust in national currencies and in these traditional financial systems is waning. Cryptocurrencies provide an alternative, decentralized investment vehicle and a “store of value” versus a nation’s fiat.
Regulatory Changes
Cryptocurrencies have flourished in an unregulated environment. And in the US, there is some confusion as to what regulatory agency has proper jurisdiction over this flourishing industry. The Securities and Exchange Commission (SEC) says cryptocurrencies should be regulated as securities like stocks or bonds. At the same time, the Commodity Futures Trading Commission (CFTC) says they should be treated as commodities like gold or silver.
Some regulation clarification is required to allow for easier ways to trade and invest in cryptocurrencies. However, if a governing body changes the rules to disfavor cryptocurrency investment or its use, such regulations could negatively affect marketplace sentiment.
Indeed, the SEC’s recent crackdown on staking and its $30 million settlement with Kraken sent ripples throughout the crypto marketplace. Both Bitcoin and Ethereum dropped about 5% while liquid staking protocols like Lido Finance and Rocket Pool advanced.
Media Coverage and Public Perception
Cryptocurrencies are extremely sensitive to good or bad news because, unlike traditional currencies, they are not regulated. Therefore, any popular sentiment or point of view created due to positive or negative news coverage directly affects public sentiment and hence their value. Even individual Twitter tweets by celebrities like Elon Musk have been shown to move crypto markets.
Competition and Cryptocurrency Market Dominance
Market cycles have a direct correlation to the price movement of certain dominant cryptocurrencies, like Bitcoin. For example, Bitcoin Dominance is a measure of Bitcoin’s market cap strength within the market cap of all other cryptocurrencies. It is one metric used to understand the interplay between Bitcoin and alternative coins. This computed ratio helps investors understand if the crypto marketplace is experiencing a downtrend (distribution phase) or uptrend (markup phase) against Bitcoin.
Here is how the Bitcoin Dominance ratio is computed:
Bitcoin Dominance (BD) = (Bitcoin Market Capitalization / Cryptocurrency Total Market Capitalization)
When the Bitcoin Dominance increases, the crypto market as a whole is expected to lose value against Bitcoin. Similarly, when the Bitcoin Dominance decreases, the crypto market is expected to gain value against Bitcoin.
Institutional Investment and Involvement
Bitcoin’s price is heavily dependent on supply and demand fluctuations, just like other cryptocurrencies. However, contrary to fiat money like the US dollar, Bitcoin’s supply will always have a hard cap of 21 million.
Higher demand for cryptocurrencies will lead to an increase in their price, especially when institutional investors get involved. For example, Bitcoin’s price trended upwards when companies like Microstrategy and Tesla added large amounts of Bitcoin to their balance sheets. Same thing occurred when Morgan Stanley and Goldman Sachs started investing in Bitcoin. This institutional involvement created a demand that outpaced the rate at which new coins were introduced into the market, decreasing the total available supply.
Availability and Accessibility of Exchanges/Marketplaces
The demand for ETH will continue to trend higher as more and more decentralized finance (DeFi) projects become available on the Ethereum blockchain. Similarly, if a DeFi project is launched, its own token will become more useful, thereby increasing demand.
Most large market cap cryptocurrencies like Bitcoin, Ether, and Tether trade on multiple exchanges. Indeed, most popular cryptocurrency’s are available on most cryptocurrency exchanges.
If a cryptocurrency becomes listed on more exchanges, it can increase the number of investors willing and able to buy it, thereby increasing demand and therefore its price will generally trend upward.
Token Offerings, Initial Coin Offerings (ICOs), and Market Trends
Today’s market is flooded with thousands of different cryptocurrencies. New projects and tokens launch daily since the competitive barriers to entry are relatively low and there are essentially no regulatory restrictions.
A blockchain application that touts utility can quickly build market momentum, especially if it improves upon a competing application. If a new competitor gains momentum, it takes value from the existing competition, thereby sending the price of the incumbent down as the new competitor's crypto sees its price move higher.
Economic Cycles and Market Trends
Recession is a frequent talking point in the present market and economic circles. There are a number of signs that are relied upon in determining whether a nation’s economy resides in a recession. These signs include a decrease in consumer confidence/spending, a rise in unemployment, a bearish stock market, an inverted bond yield curve, and multiple decreases in GDP.
A recession will likely have multiple effects on the crypto marketplace. First, crypto values depreciate. Second, investors avoid risky projects and pursue the least risky projects. Third, crypto companies increase layoffs. And fourth, the crypto market experiences lower volume and trading activity.
Using Crypto Market Cycles to Generate Profits
Effective crypto traders possess a sound understanding of the cyclical nature of crypto markets. With this understanding, traders utilize various methods to properly time their trade entry and exit points.
Multi-Time Frame Analysis
A popular timing method for making better trading decisions involves multi-time frame analysis. Multiple time frame analysis is the process of viewing a cryptocurrency’s price movement via different time frames to study long and short-term trends.
This allows for the identification of the various trends and phases making up a crypto market cycle. For example, traders may rely upon a 1-hour chart to identify short-term trends while using a 5-hour chart to confirm the development of a particular market phase.
Buying the Dip
Some traders focus their trading efforts on buying when a crypto’s price experiences a dip. A dip or pullback represents a short-term, minor drop in asset price.
From some, market pullbacks represent a trading opportunity to generate profits but these buy the dip traders rely on a few assumptions. First, they assume that the crypto’s price has fallen from a peak. Second, they assume that the dip is temporary and that the price will rebound in the near or intermediate future. Having a working understanding of the overall market cycles will help traders better gauge the validity of these assumptions.
Dollar-Cost Averaging
Dollar-cost averaging (DCA) is a technique that invests small increments at regularly scheduled intervals. The strategy uses changes in the market price over long periods of time.
The choice of market entry is perhaps the most challenging task for traders and investors. The variety of trading signals is so extensive that, at times, it may be confusing to choose the most opportune time to invest. Even experienced traders make mistakes when reading the market. DCA helps to mitigate these risks.
As DCA involves the regular purchase of a particular asset for a fixed dollar value, its key goal is to decrease the impact of a volatile market. This method helps to smooth out the average price when a purchase is made, instead of making a lump sum investment.
Mean Reversion Strategy
This strategy relies on the theory that a price will always revert or transition back to its mean or average. It assumes that a price that moves away from a long-term average level will again return to this average. That implies that buyers should buy low and sell high.
In other words, if a long order is placed when the price of the asset is low – below its mean – the trader is anticipating that the price will eventually revert to its higher average. Similarly, if a short order is placed when the price of the asset is high – above the mean – the trader is anticipating that the price will revert to its lower average.
Conclusion
There are no guarantees when predicting price movements of highly volatile, speculative cryptocurrencies. One way to stay ahead of the trading game is to recognize that cryptocurrencies move in market cycles. This enables traders to make educated and informed decisions as to future price movements which can be critical in timing market entry and exit points. An optimal strategy is one where entry occurs during the accumulation phase when the market is fearful. Then, HODL on the way up during the markup phase. Traders should then sell during the distribution phase when everyone is happy and greedy, thereby exiting before the market plunges during the markdown phase.

Disclaimer: All investments involve risk, and the past performance of a security, industry, sector, market, financial product, trading strategy, or individual’s trading does not guarantee future results or returns. Investors are fully responsible for any investment decisions they make. Such decisions should be based solely on an evaluation of their financial circumstances, investment objectives, risk tolerance, and liquidity needs. This post does not constitute investment advice.

Painless trading for everyone
Hundreds of markets all in one place - Apple, Bitcoin, Gold, Watches, NFTs, Sneakers and so much more.
Painless trading for everyone
Hundreds of markets all in one place - Apple, Bitcoin, Gold, Watches, NFTs, Sneakers and so much more.