
In the world of cryptocurrency trading, having the right tools and insights can make all the difference. One such tool that has gained popularity among traders is the Crypto Rainbow Chart. This comprehensive guide will take you through everything you need to know about this powerful chart and how to use it effectively.
Historical Context of the Crypto Rainbow Chart
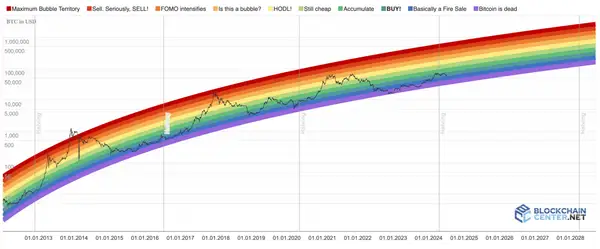
The Crypto Rainbow Chart was first introduced by a Bitcoin enthusiast and analyst to provide a visual representation of Bitcoin's price movements over time. The chart gained popularity due to its intuitive design and the way it encapsulates market sentiment in a single glance. The concept is based on the logarithmic growth trends observed in Bitcoin's price history, with different color bands indicating various levels of market sentiment and potential action points for investors.
Originally, the chart was inspired by the need for a simple yet effective way to understand Bitcoin's price volatility and long-term trends. It was created to help investors make more informed decisions based on historical price data. As Bitcoin's price history has grown, the chart has been updated to include more data, improving its accuracy and relevance. The color bands have also been fine-tuned to better reflect market conditions.
How to Read the Crypto Rainbow Chart
To read the Crypto Rainbow Chart effectively, follow these steps:
-
Identify the Current Color Band: Check where the current price of Bitcoin falls within the color bands:
- Red Zone: Indicates that Bitcoin is in a potential bubble, and the market sentiment is extremely high.
- Orange to Yellow Zones: Suggests that the market is bullish, and there's significant buying interest.
- Green Zone: Implies a steady market where holding Bitcoin might be wise.
- Blue to Violet Zones: Indicates that Bitcoin is undervalued, and it might be a good time to buy or accumulate.
-
Historical Price Movements: Look at past price movements within each color band to understand how Bitcoin has historically behaved at similar levels.
-
Trend Analysis: Use the chart to spot long-term trends rather than short-term price movements. The logarithmic nature helps in identifying macro trends.
Detailed Explanation of Each Color Band
Maximum Bubble Territory (Red)
- Description: This zone suggests that Bitcoin is highly overvalued and may be in a speculative bubble.
- Historical Examples: Past instances when Bitcoin entered the red zone often preceded significant price corrections.
- Investor Action: Consider selling or taking profits as the market sentiment is extremely bullish and prices may be unsustainable.
Sell (Orange)
- Description: Indicates that Bitcoin is overvalued but not in extreme bubble territory.
- Historical Examples: Bitcoin often sees slower price growth or minor corrections in this zone.
- Investor Action: Caution is advised. It may be wise to sell or reduce holdings.
FOMO (Yellow)
- Description: Reflects heightened market excitement and strong buying pressure.
- Historical Examples: This zone typically precedes the peak of bullish cycles.
- Investor Action: Monitor market conditions closely; consider taking profits if significant gains have been realized.
HODL (Green)
- Description: Suggests a balanced market where holding Bitcoin is a viable strategy.
- Historical Examples: Bitcoin often experiences stable growth in this zone.
- Investor Action: Holding is recommended; avoid making impulsive decisions.
Accumulate (Blue)
- Description: Indicates that Bitcoin is undervalued, presenting a potential buying opportunity.
- Historical Examples: Periods in this zone have historically been good times to buy and accumulate Bitcoin.
- Investor Action: Consider buying or increasing positions.
Buy (Violet)
- Description: Reflects extreme undervaluation and a strong buying opportunity.
- Historical Examples: This zone has often preceded significant price increases.
- Investor Action: Strong buy signal; consider accumulating aggressively.
Bitcoin Rainbow Chart Overview for July 2024
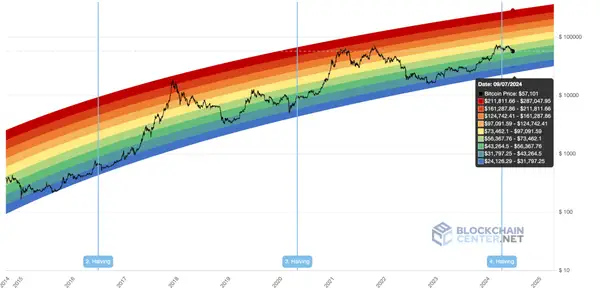
Throughout July 2024, Bitcoin's price has shown significant activity, reflecting various levels on the Crypto Rainbow Chart. As of the 9th of July, Bitcoin is priced at $57,101, placing it within the range of $43,264.5 – $56,367.76 on the chart. This positions Bitcoin in the green zone, which implies a steady market where holding Bitcoin might be wise. The market sentiment at this level suggests that Bitcoin is neither significantly overvalued nor undervalued, making it a balanced time for investors to hold their positions and avoid making impulsive decisions.
During this month, Bitcoin has generally fluctuated within the green and lower yellow bands, indicating periods of moderate buying interest and a balanced market sentiment. Investors observing the Crypto Rainbow Chart would notice that the current pricing aligns with historical data suggesting stable growth patterns, which encourages a strategy of holding or cautiously accumulating Bitcoin.
Historical data indicates that Bitcoin often experiences stable growth in the green zone. The broader overview for July 2024 also shows that there have been moments when Bitcoin briefly touched the lower edges of the yellow band, reflecting heightened market excitement and strong buying pressure. However, the price has generally remained stable, with no extreme volatility, supporting the sentiment of cautious optimism among investors.
Stay up-to-date with the latest market news using Morpher AI! Available free for every Morpher user, Morpher AI acts as your personal assistant, gathering all the right and relevant information without endless scrolling. Sign up for Morpher now and experience it yourself!
How Reliable is it Compared to Other Charts?
The reliability of the Crypto Rainbow Chart can be assessed by comparing it to other analytical tools. The chart's reliance on historical data provides a long-term perspective but may not account for unprecedented future events. It is useful for gauging market sentiment over time, benefiting long-term investors but less so for short-term traders. Compared to technical analysis, which uses various indicators for short-term predictions, the Crypto Rainbow Chart focuses on long-term trends and sentiment, lacking the granular detail of technical analysis. While the chart highlights periods of potential overvaluation or undervaluation, it should not be used in isolation. Combining it with other forms of analysis, such as fundamental and technical analysis, provides a more holistic view. However, the chart might not be reliable during extreme market conditions like major regulatory changes, significant technological advancements, or black swan events.
Limitations and Criticisms
Despite its usefulness, the Crypto Rainbow Chart has limitations and criticisms. Over-reliance on historical data may not always predict future performance accurately, as market dynamics can change due to unforeseen events. The chart simplifies the complexities of the cryptocurrency market into color bands, potentially overlooking important nuances. It is designed for long-term trend analysis and is less useful for short-term trading strategies. The color bands and sentiment they represent are somewhat subjective, with different investors interpreting them based on their risk tolerance and investment strategy. Additionally, the chart does not incorporate fundamental factors such as technological developments, regulatory changes, or macroeconomic trends that can significantly impact Bitcoin's price.
In conclusion, the Crypto Rainbow Chart is a valuable tool for understanding the long-term trends and market sentiment of Bitcoin. It offers a colorful and intuitive way to visualize Bitcoin's historical price movements. While the chart provides useful insights, it should be used in conjunction with other analytical tools and a comprehensive research approach to make informed investment decisions.
FAQ: Frequently Asked Questions
Q: How do I read the Crypto Rainbow Chart effectively?
A: Reading the Crypto Rainbow Chart effectively requires a solid understanding of the color-coded market phases and their meaning. Take the time to familiarize yourself with each phase and practice analyzing historical price data with the chart. This will help you develop a more intuitive grasp of the chart's insights.
Q: Can the Crypto Rainbow Chart predict future price movements with certainty?
A: While the Crypto Rainbow Chart provides valuable insights into market trends, it cannot predict future price movements with certainty. It is essential to use the chart as a tool alongside other indicators, fundamental analysis, and market research to make well-rounded trading decisions.
Q: What are the advantages of using the Crypto Rainbow Chart?
A: The advantages of using the Crypto Rainbow Chart include its ability to identify market phases, predict trends, and aid in risk management. It provides a comprehensive view of price action and helps traders make more informed decisions in the cryptocurrency market.
Q: Can the Crypto Rainbow Chart be used for all cryptocurrencies?
A: Yes, the Crypto Rainbow Chart can be used for analyzing the price movements of various cryptocurrencies. Whether you are trading Bitcoin, Ethereum, or any other cryptocurrency, the chart's principles and color-coded phases remain consistent.
In conclusion, the Crypto Rainbow Chart is a powerful tool that can greatly enhance your cryptocurrency trading. By understanding its components, reading and interpreting the chart effectively, and implementing suitable strategies, you can navigate the ever-changing cryptocurrency market with confidence. Remember to use the chart as a part of a comprehensive trading approach and stay updated with the latest market developments. Happy trading!
Ready to elevate your trading experience with the insights from the Crypto Rainbow Chart? Look no further than Morpher, the revolutionary trading platform that's changing the game with zero fees, infinite liquidity, and a plethora of unique trading options across various asset classes. Embrace the power of blockchain technology and take advantage of fractional investing, short selling without interest fees, and up to 10x leverage to maximize your trading potential. Sign up now at Morpher.com and get your free sign-up bonus to start your journey towards democratized, innovative, and flexible trading.

Disclaimer: All investments involve risk, and the past performance of a security, industry, sector, market, financial product, trading strategy, or individual’s trading does not guarantee future results or returns. Investors are fully responsible for any investment decisions they make. Such decisions should be based solely on an evaluation of their financial circumstances, investment objectives, risk tolerance, and liquidity needs. This post does not constitute investment advice.

Painless trading for everyone
Hundreds of markets all in one place - Apple, Bitcoin, Gold, Watches, NFTs, Sneakers and so much more.
Painless trading for everyone
Hundreds of markets all in one place - Apple, Bitcoin, Gold, Watches, NFTs, Sneakers and so much more.