Hanging Man Pattern
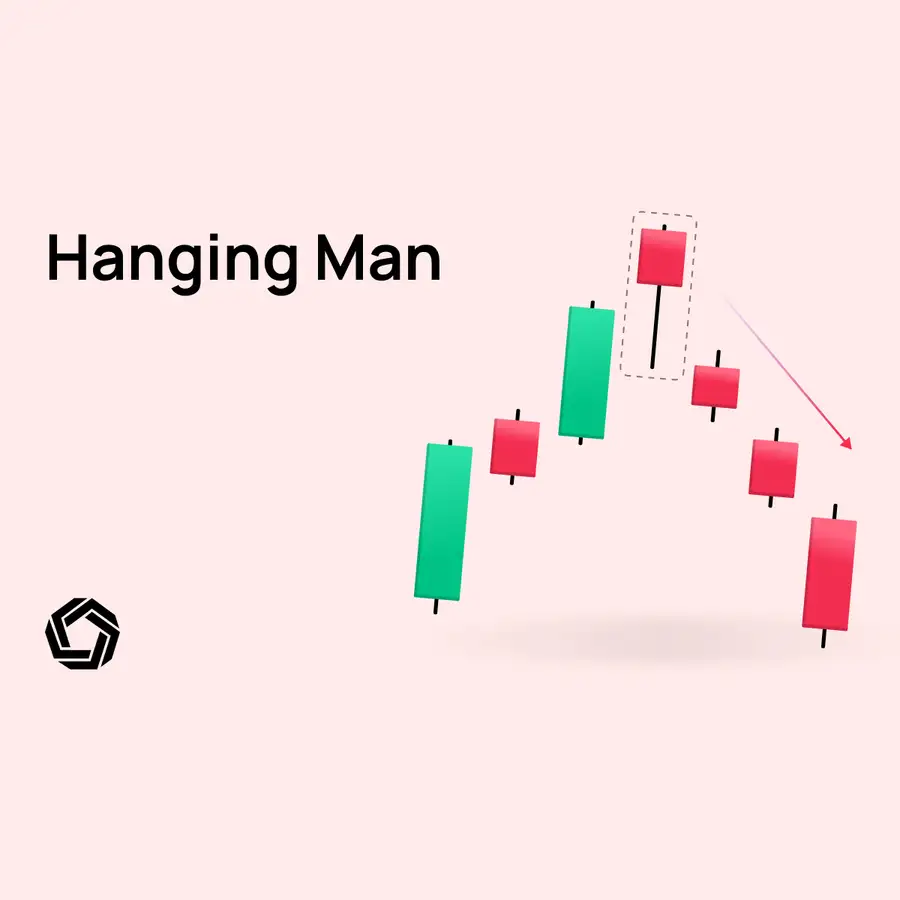
The Hanging Man pattern is a widely recognized candlestick pattern among traders. In this article, we will provide valuable insights on how to incorporate this pattern into your trading strategy. Despite its subtle nature, we will offer a comprehensive guide on how to spot the Hanging Man pattern and leverage it in your trading approach.
In addition to this, a well-rounded trader should have a diverse portfolio. Therefore, we will provide you with three alternative trading approaches that are ideal for trading in various markets, such as Stocks, Cryptocurrencies, Commodities, Forex, and even NFTs.
However, it is important to note that successful trading with candle charts goes beyond just recognizing patterns. You must also consider the context of risk and reward before making a trade based solely on a candle pattern. A thorough understanding of risk/reward analysis is crucial for making informed trading decisions.
Hanging Man Pattern
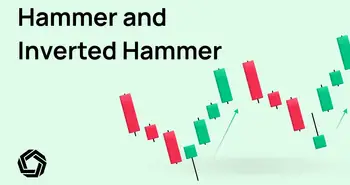
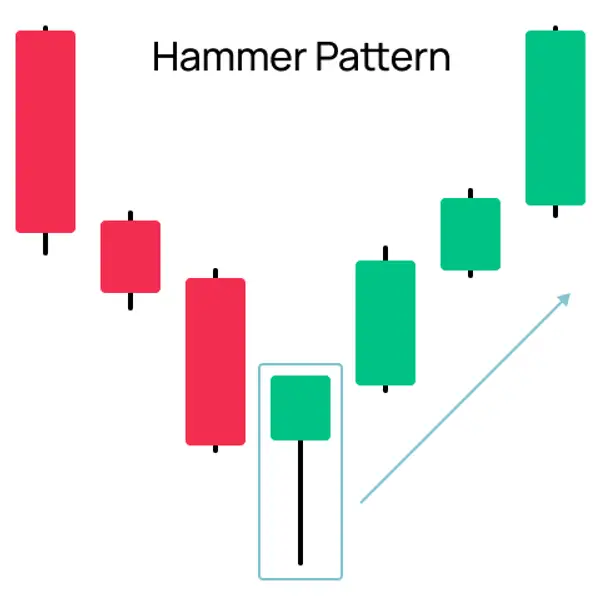
The hanging man pattern shares a similar shape to the hammer pattern, with the only difference being that it appears after an upward trend. The longer shadow on the hanging man is typically viewed as a positive, making it crucial to wait for bearish confirmation before taking action. This confirmation usually involves a lower opening below the hanging man's real body or a close beneath it.
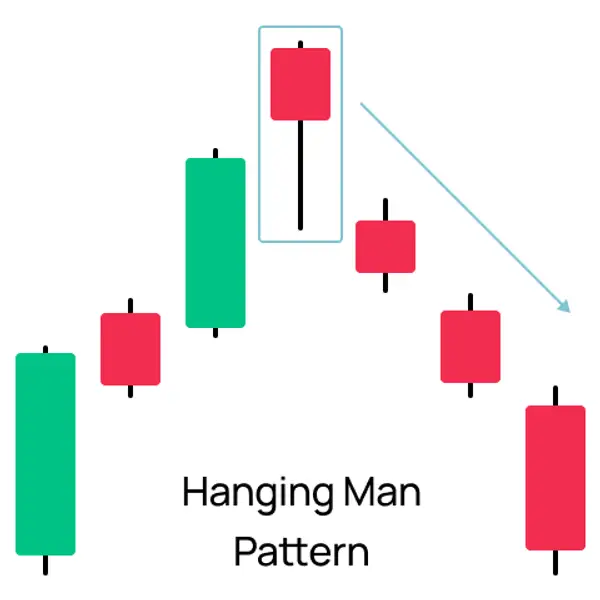
It's advisable to wait for confirmation because if the market closes lower the next day, those who bought on the hanging man day may be left with a losing position; hence the term “hanging.” This is especially true when the hanging man pattern appears at an all-time high or a high for a significant move. In such cases, the longs entering at the hanging man position tend to be more nervous and may decide to back out of their losing position. This can trigger more selling pressure, so caution is important.
It's worth noting that the color of the hanging man's real body is not as important as the following candle. Additionally, it's crucial to differentiate between the hanging man as a bearish reversal pattern and the hammer as a bullish reversal pattern.
What Does a Hanging Man Pattern Look Like?
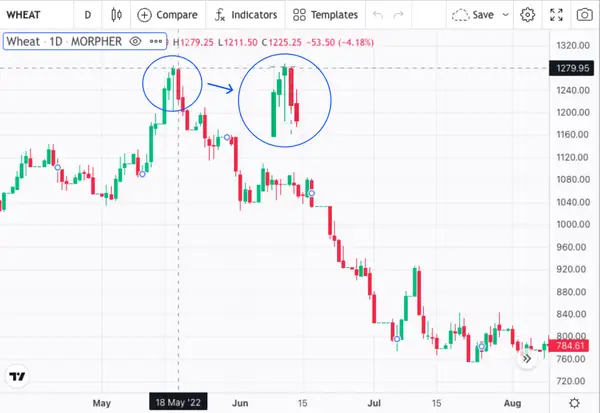
Here we can see a nice hanging man candlestick pattern. It appears after an uptrend and is followed by a long red candle, confirming the future downtrend. Everyone who could have identified the pattern here and shorted the market would have made a nice profit from the 1200 level to the 800 level.
While successful patterns are typically showcased in charts, we believe it's important to also examine failed patterns for educational purposes. In this case, we'll use a Bitcoin chart to illustrate a failed hanging man pattern, given the cryptocurrency's history of frequently frustrating short sellers.
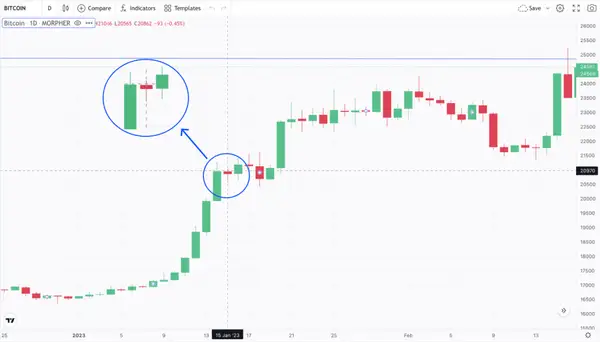
The chart depicts a strong uptrend, with seven consecutive green candles leading up to January 15th, 2023, when a hanging man pattern began to emerge. Despite having a slight shadow at the top, the pattern was well-formed. However, it's essential to consider the entire pattern and not just a single candlestick.
It's important to note that a hanging man pattern is not confirmed until the subsequent candle closes below the hanging man's real body. In this instance, the next candle was, in fact, another green candle, which would have wrecked anyone who relied solely on a partially completed candlestick pattern.
Hanging Man Pattern Strategy Ideas
The next three strategies are actually universal and could be applied to any asset class.
Strategy 1: Williams Fractal and Alligator Indicator
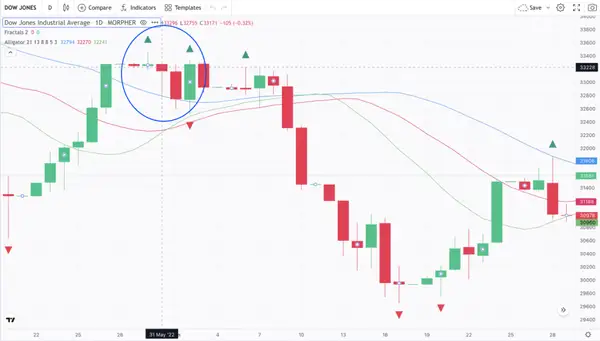
The first strategy involves technical analysis using two Williams Indicators: the Fractal and the Alligator.
The Williams Fractal is used to identify potential price reversals. It draws arrows to indicate the existence of a pattern. Bullish fractals are marked by a down arrow below the candlestick, and bearish fractals are marked by an up arrow above the candlestick.
The Alligator Indicator, on the other hand, is used to identify trends and their direction and to determine potential trend changes. When the three lines are intertwined, the alligator is said to be sleeping, indicating that the market is ranging. When the lines diverge, the alligator is said to be eating, indicating that the market is trending.
For example, consider a hanging man pattern that appeared on May 31st, 2022, on the Dow Jones Industrial Average Index chart after a short uptrend in an overall downtrend. Although hanging man patterns are rare and challenging to identify in a perfect setting, we can still use a decent approximation if the other indicators point in the right direction.
In this scenario, the Fractal Indicator displayed an upper triangle a day before, indicating a sell signal. The Alligator Indicator also suggested that bearish momentum would continue to trend down as it was tightening rapidly. Finally, the candle closed below the hanging man pattern, further confirming taking a short position.
This trade could have been kept for almost a month, from 32400 down to 29800, when the next downward Fractal Indicator was displayed, signaling the end of the trend.
Strategy 2: Momentum Indicator
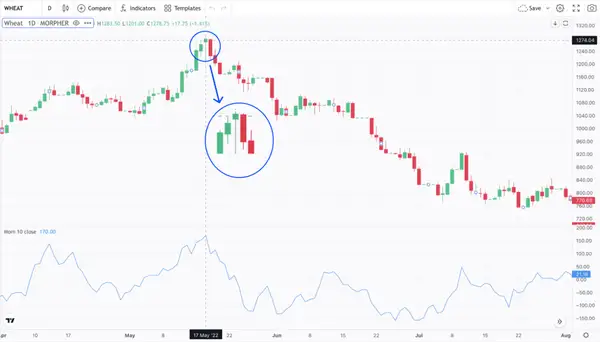
This straightforward strategy can be highly effective in almost any asset class, especially when combined with candlestick patterns. The key indicator to use here is the momentum indicator.
The Momentum Indicator compares the current price to its price n-periods ago and displays the result as a single line oscillating above and below a zero line. If the Momentum Indicator line oscillates above the zero line, it indicates a bullish trend; if it goes below zero, it indicates a bearish trend.
In this case, we are looking for a hanging man pattern to identify a potential trend reversal in an uptrend of the wheat chart. It is essential to identify clear patterns with commodities, which can be more challenging in other markets. We found a nice hanging man pattern on the wheat chart on May 17, 2022. Typically, we wait for confirmation the following day, and in this case, we saw a large red candle closing, providing the necessary confirmation. Additionally, the momentum indicator indicated that we had reached a top, as it almost went up to the max of 200, further supporting the bearish outlook.
We entered a short position at the 1200 price point and protected ourselves with a stop loss at around 1280. This trade would have been highly profitable, especially with the application of some leverage due to the clarity of the indicators. Overall, this simple yet effective strategy can yield substantial profits when used correctly.
Strategy 3: Detrend Price Oscillator and TRIX
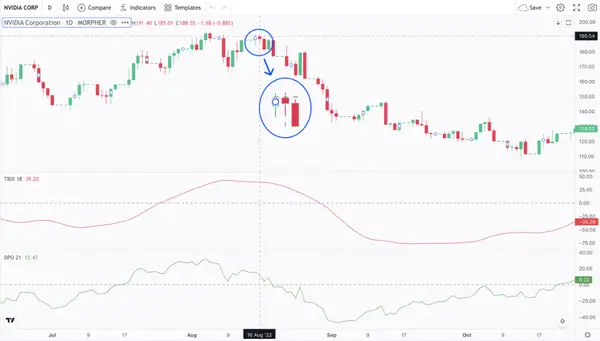
Our final strategy is a bit more complex than the previous two. It involves two indicators that identify cycles and momentum in price movements: the Detrended Price Oscillator (DPO) and the Triple Exponential Average (TRIX) indicator. For a live trading scenario demonstration of this strategy, we used the NVIDIA chart.
The Detrended Price Oscillator (DPO) measures the difference between an asset's price and its moving average, helping to identify potential trend changes. When the DPO is above zero, it indicates bullishness; when it is below zero, it indicates bearishness.
The Triple Exponential Average (TRIX) calculates the rate of change in an asset's price over time and can help identify trend reversals. When the TRIX is above its signal line, it indicates bullishness; when it is below its signal line, it indicates bearishness.
After an uptrend that started in mid-July 2022 and was confirmed by both indicators, we observed the trend weakening on the DPO and the TRIX flattening out as we approached August 16. While it's not as straightforward as the previous examples, experts suggest that the DPO crossing the 0 line might be a good sell indicator.
On August 16, a hanging man pattern formed, and we waited for confirmation before entering the short position at around the 180 level. The DPO already suggested a move below 0 was likely, and the TRIX was also slowly moving in a downward direction as it went from almost 50 to around 39.
As stock charts are more subjective than commodities, we always protect ourselves with a stop loss, which in this case would be around the 190 mark. Ultimately, the trade proved to be a good choice, and we closed it at around the 120 price level once the DPO crossed into the buying zone.
Best Platform to Trade Candlestick Patterns
When trading candlestick patterns, having the right platform is crucial to success. Here are some key factors to consider when choosing the best platform:
- Maximum Flexibility: Look for a platform that allows you to go long or short on any asset and use leverage to profit from even the smallest signals in any direction.
- Variety of Assets: A good platform should offer a diverse range of assets to trade from, including stocks, cryptocurrencies, commodities, forex, and unique markets. This ensures you can always find useful patterns and profitable markets to trade.
- Great Indicators and Advanced Chart View: The platform should have great indicators and an advanced chart view that allows you to save templates you have created and combine multiple indicators to get the best edge possible.
- Infinite Liquidity: Choosing a platform with infinite liquidity is important, so you can close every position at the exact price you aimed for and have no slippage.
- Zero Fees: Look for a platform that offers zero fees, so even if you want to scalp some quick profits, you do not lose on the fees. Combined with fractional trading, you can get in on every position for less than $1.
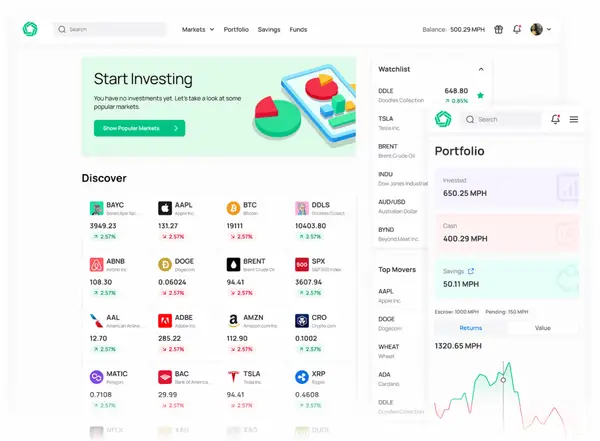
If you're looking for a platform that offers all of these features, Morpher is a great choice. It's specifically designed to provide the best trading experience possible, with maximum flexibility, a wide range of assets to trade, great indicators and an advanced chart view, infinite liquidity, and zero fees.
Conclusion
In conclusion, these patterns have proven to be valuable tools for making profitable trades. By incorporating the Hanging Man Pattern into your trading strategy and using technical indicators to identify market trends, you can maximize your chances of making informed trading decisions.

Disclaimer: All investments involve risk, and the past performance of a security, industry, sector, market, financial product, trading strategy, or individual’s trading does not guarantee future results or returns. Investors are fully responsible for any investment decisions they make. Such decisions should be based solely on an evaluation of their financial circumstances, investment objectives, risk tolerance, and liquidity needs. This post does not constitute investment advice.

Painless trading for everyone
Hundreds of markets all in one place - Apple, Bitcoin, Gold, Watches, NFTs, Sneakers and so much more.

Painless trading for everyone
Hundreds of markets all in one place - Apple, Bitcoin, Gold, Watches, NFTs, Sneakers and so much more.

