Article Contents


Expert
Price action trading is a popular trading strategy that involves analyzing the price movements of a security to identify trading opportunities. Price action traders believe that the price of a security already reflects all of the available information and that by analyzing price movements, they can identify trends and patterns that can be used to make profitable trades.
There are many different price action trading strategies, but some of the more popular are the breakout retest, the confluence strategy, and a strategy combining Guppy Multiple Moving Average (GMMA) and pin bars.
In the following post, we will discuss each of these strategies in more detail and provide examples of how they can be used to make profitable trades. We will also discuss some of the risks associated with price action trading and how to mitigate those risks.
Price Action Trading Strategy Ideas
Breakout Retest Strategy
The price action breakout retest strategy is a popular trading strategy that focuses on identifying breakouts from key levels of support or resistance and then waiting for a retest of the broken level to confirm the breakout. This strategy aims to take advantage of the potential continuation of the breakout move while minimizing the risk of false breakouts.
Here is a step-by-step explanation of how to implement this price action strategy.
First, identify key levels of support or resistance. These levels can be horizontal levels, trendlines, or other significant areas where the price has historically shown strong reactions.
Traders often use swing highs and swing lows to identify these key levels.
For example, a swing high is a high point in the price of an asset where the price has recently been rising and is expected to stop before continuing to move upward. Conversely, a swing low is a low point in the price of an asset where the price has recently been falling and is expected to stop before continuing to move downward.
Multiple swing highs and swing lows are identified in the Bitcoin price chart reproduced below.
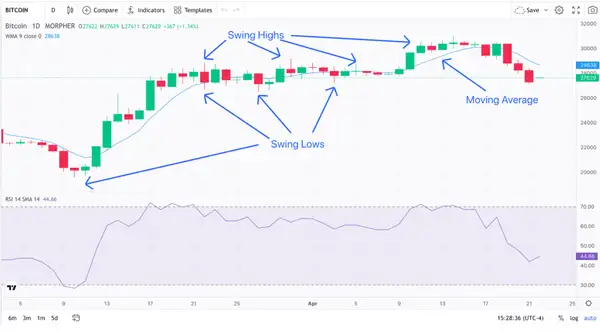
Swing Highs, Swing Lows, and Moving Average for Bitcoin 1-Day Chart (source: Morpher)
Once the key levels are identified, traders watch for a breakout. Breakouts are formed when the Bitcoin price action breaks through support or breaks through resistance. For example, note the bullish Bitcoin breakout illustrated below.
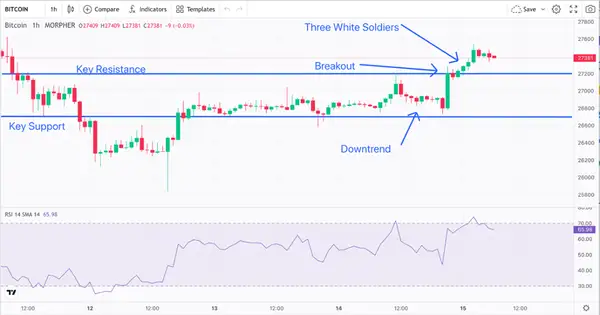
RSI, Resistance, Support, and Breakout Bitcoin 1-Hour Chart (source: Morpher.com)
This breakout can be confirmed by a strong bullish or bearish candle, a surge in trading volume, or a combination of both. Traders look for a breakout candle formation above the key support level (like the Three White Soldiers pattern formation above) to validate the breakout.
After the breakout, the next step is to wait for a retest of the broken level. In one instance, the retest may take place where the price returns to the broken level and tests it as a new support or resistance level. Traders look for the price to touch or come close to the broken level without penetrating it.
Once the retest is complete, traders look for confirmation signals to enter a trade. They seek price action signals that indicate a rejection of the retest level, such as bullish/bearish candlestick patterns, long wicks, or price rejection from the level. These signals suggest that the broken level is holding as support or resistance, reinforcing the validity of the breakout.
To manage risk, traders should place a stop loss order below the retest level (in case of a long trade) or above the retest level (in case of a short trade) to limit potential losses if the trade does not work out. The take profit level can be set based on factors like the distance of the initial breakout move or the presence of other key support/resistance levels.
Once the trade is entered, traders need to actively manage it. This involves monitoring the price action, adjusting stop loss levels if necessary, and considering partial profit-taking as the trade moves in their favor. Traders may also trail their stop loss to lock in profits as the trade progresses.
Here is an example of implementing a price action breakout retest strategy.
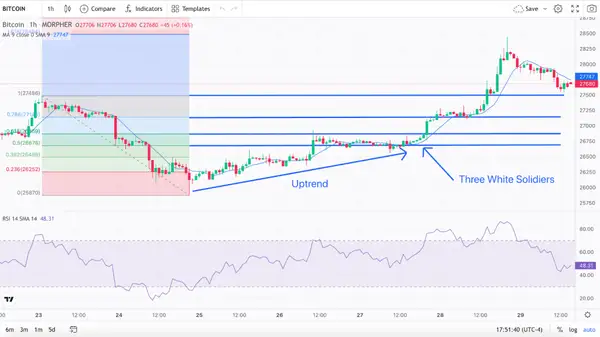
First, key levels of support and resistance are identified. A potential bullish uptrend is also identified. Bitcoin then undergoes a potential breakout at the Bitcoin price of $26,800.
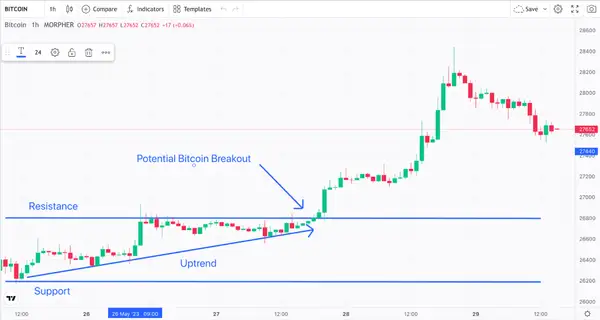
Trend, Resistance, Support, and Breakout Bitcoin 1-Hour Chart (source: Morpher.com)
After this bullish breakout, Bitcoin continues its upward trend demonstrating bullish candlestick patterns, including a swing high followed by a neutral doji. This doji candlestick pattern that forms during an uptrend could signify bullish exhaustion, i.e., more buyers moving to the sellers’ side.
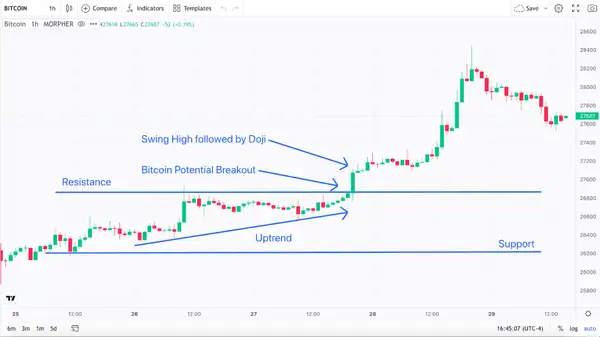
Trend, Resistance, Support, Breakout, and Swing High with Doji Bitcoin 1-Hour Chart (source: Morpher.com)
But this Doji is then followed by the formation of a positive uptrend in what appears to develop a new support level. As such, these bullish signals confirm that breakout is not a false breakout.
We would therefore enter a long position at this level, perhaps around $27,200.
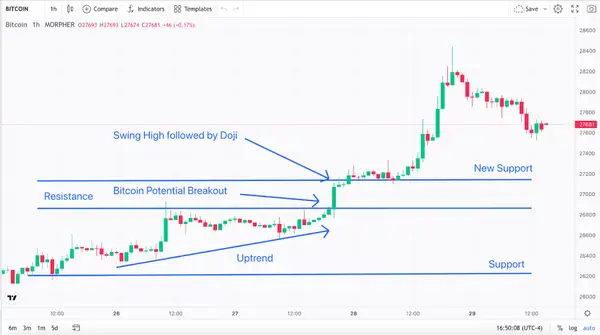
Trend, Resistance, New Support, Breakout, and Swing High with Doji Bitcoin One-Hour Chart (source: Morpher.com)
To manage risk, we would place a stop loss order ($26,700) below the retest level (the new support level of $27,200) to limit potential losses if our trade does not work out. We would also establish take profit levels at a first level of $27,400 and a second level of $27,600.
We would then actively manage this trade by adjusting our initial stop loss level at $26,700 and consider partial profit-taking as the trade moves in our favor, as illustrated.
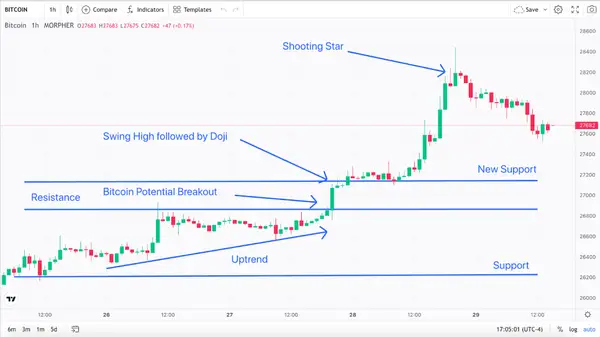
Shooting Star, Trend, Resistance, Support, Breakout, and Swing High with Doji Bitcoin 1-Hour Chart (source: Morpher.com)
However, seeing a shooting star develop during this uptrend and indicating a potential bearish reversal, we would exit this trade at around $28,200 (before the beginning of the downtrend). Here the bearish shooting star denotes that the sellers took Bitcoin’s closing price below its opening price.
Confluence Strategy
The price action confluence strategy is a trading approach that combines multiple price action signals to increase the probability of successful trades. It involves identifying and analyzing different price action elements that align with each other, creating a confluence of signals that provides a stronger indication of market direction. By looking for multiple confirming factors, traders aim to filter out potential false signals and focus on higher-probability trades.
Here is a step-by-step explanation of how one can implement this price action strategy.
The first step is to identify key levels of support, resistance, or other significant areas on the price chart. These levels can be determined through swing highs and swing lows, trendlines, Fibonacci retracements, or previous price reactions.
Traders analyze candlestick patterns to gain insights into market sentiment and potential reversals. They look for patterns such as engulfing patterns, doji, hammers, shooting stars, or bullish and bearish pin bars that occur near the identified key levels. These patterns provide indications of possible market direction changes or continuation of existing trends.
Traders assess the overall trend of the market using tools like moving averages or trendlines. They look for alignment between the trend direction and the potential trade setup. Trading in the direction of the prevailing trend increases the probability of success.
Traders may incorporate technical indicators or oscillators that align with the identified price action setup. For example, they might use the Relative Strength Index (RSI), Stochastic Oscillator, or Moving Average Convergence Divergence (MACD) to confirm the price action signals. If the indicators show oversold or overbought conditions or exhibit bullish or bearish divergences, it adds weight to the confluence.
Volume can provide valuable insights into the strength of price movements. Traders look for volume patterns that confirm the identified price action setup. For example, a breakout accompanied by high trading volume indicates strong market participation and validates the breakout.
Multiple timeframes may be incorporated to gain a broader perspective on price action. Price action traders typically consider longer timeframes (daily or weekly charts) to observe general trends while alternating to shorter timeframes (hourly or 30-minute charts) for more refined entry and exit points. Aligning signals across multiple timeframes strengthens the confluence of signals.
Traders enter a trade when they observe a confluence of multiple factors aligning. This could include the combination of a key level, candlestick pattern, trend direction, indicator confirmation, and volume analysis. The more factors that support the trade setup, the higher the confidence level.
Traders should determine an appropriate position size based on their risk tolerance and set stop-loss orders to limit potential losses. Take-profit levels can be based on factors like the distance to the next key level or the presence of other significant price barriers.
Once the trade is open, traders actively monitor the price action and adjust their trade management accordingly. This includes trailing stop losses, considering partial profit-taking, or exiting the trade if the confluence of factors starts to weaken.
Here is an example of how the price action confluence strategy can be implemented.
In the first step, we identify key levels of support, resistance, or other significant areas on the price chart, including a potential upward trend. These levels are generated by way of Fibonacci retracements, defining the various Fibonacci levels 0.236, 0.382, 0.5, and others, as noted.
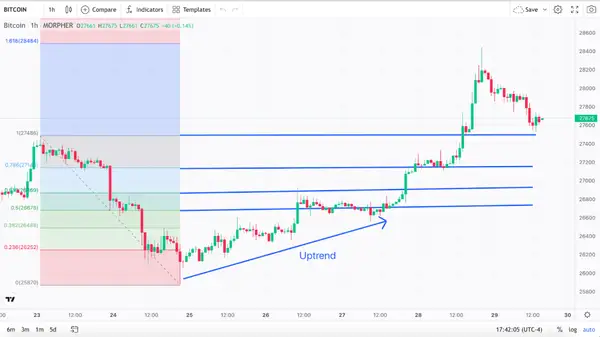
Fibonacci Retracements, Uptrend, and Bitcoin One-Hour Chart (source: Morpher.com)
Once the price action breakthrough occurs at the 0.5 Fibonacci level, we look for confluence amongst the various factors. At the breakthrough, we note that the moving average provides a neutral indication as the pricing resides above the moving average. However, at the time of the breakthrough, the RSI value designates an oversold condition.
Fibonacci Retracements, Uptrend, Moving Average, RSI, and Bitcoin One-Hour Chart (source: Morpher.com)
Thereafter we observe the formation of a bullish Three White Soldier formation.
With this bullish candlestick formation, we would enter our trade at the open of the next candle after the completion of this bullish pattern. We would also set a stop loss at the Fibonacci 0.382 level, one level below our entry point. Note the Bitcoin finds initial resistance at the Fibonacci 0.382 level, but then the level converts into support.
To capture profits, we would set take profit levels at the Fibonacci levels of 0.618 and 0.786, with an ultimate trade exit at the Fibonacci 1.0 level.
GMMA and Pin Bars
The Guppy Multiple Moving Average (GMMA) and pin bar strategy is a combination of two technical analysis tools. The GMMA consists of two groups of moving averages: a short-term group and a long-term group. These averages provide insights into the overall trend and market sentiment.
Pin bars are candlestick patterns that indicate potential reversals or trend continuation.
Here are the steps involved in the price action GMMA and pin bar strategy.
First, plot the GMMA on your price chart. The short-term group typically consists of faster moving averages, such as the 3, 5, 8, 10, or 12-period moving averages (noted in blue in the price chart below). The long-term group consists of slower moving averages, such as the 30, 35, 40, 45, or 50-period moving averages (noted in red in the price chart below).
The short-term group represents short-term trends, while the long-term group represents long-term trends.
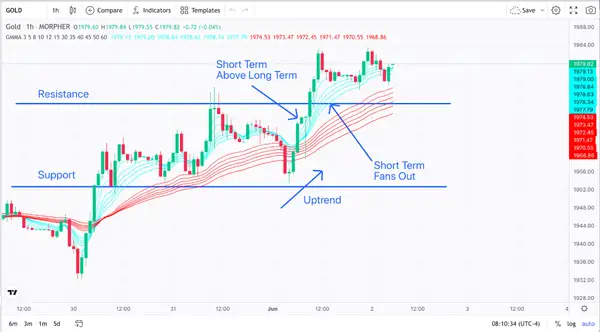
GMMA and Gold One-Hour Chart (source: Morpher.com)
Then, analyze the interaction between the short-term and long-term GMMA lines. When the short-term group crosses above the long-term group and the moving averages start to fan out, it indicates a potential uptrend. Such an uptrend is observed in the gold price chart reproduced above.
Conversely, when the short-term group crosses below the long-term group and the moving averages start to converge, it suggests a potential downtrend. These crossovers provide a visual representation of trend transitions.
Once the trend transition is identified, traders focus on price action. For example, look for possible entry points designated by pin bar price action patterns. These identify potential reversal signals in the market. It involves identifying pin bar candlestick patterns, which have a distinct appearance with a long upper or lower tail (wick) and a small body.
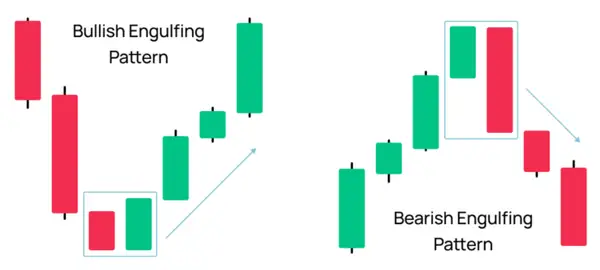
Bullish and Bearish Pin Bar Patterns (source: Morpher.com)
As illustrated above, a bullish pin bar pattern comprises a long lower tail and a small body near the top of the candlestick. A bearish pin bar comprises a long upper tail and a small body near the bottom of the candlestick. The tails (wicks) represent a rejection of price levels, and the small body indicates a shift in market sentiment.
Next, consider the location of the pin bar in relation to significant support or resistance levels, trendlines, or other technical factors. Pin bars that form at key levels or in confluence with other price action signals carry higher significance. The location adds context to the potential reversal signal.
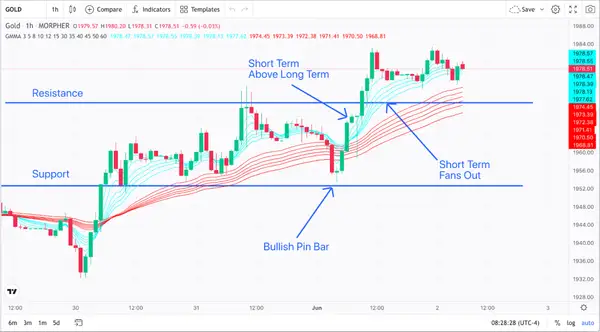
GMMA, Bullish Pin Bar Pattern, and Gold One-Hour Chart (source: Morpher.com)
In the gold price action chart provided above, note that the bullish pin bar approached a key support level while it also extended well outside the long term moving average group, thereby providing further indication of a reversal.
Next, validate the pin bar signal with additional factors to increase the probability of success. Look for confirmation from other price action elements, such as trend analysis, other candlestick patterns, or technical indicators. For example, if a bullish pin bar forms near a strong support level and confirms an uptrend, it adds weight to the trade setup. And indeed, this is exactly what happened to gold’s price action.
As such, we would enter our trade at the open of the next candle since this candlestick pattern confirms the bullish pin bar signal of an uptrend.
We would also place a stop loss order below the low of a bullish pin bar if the trade goes against our position, near or directly below the noted support level.
We would also set our target profits based on the location of this illustrated key resistance level, perhaps just outside the outermost short-term moving average. We would also use a trailing stop to capture more profits if the market continues to move in our favor.
Once in the trade, we would actively manage this trade and monitor gold’s price action and make adjustments as needed. As the price approaches the key resistance level and then breaks through (as it did), we would implement a trailing stop loss to lock in profits as the trade progresses.
If the price shows signs of reversing or the pin bar's significance diminishes, we would consider exiting the trade. For example, as illustrated above, we would consider exiting this trade once the resistance level breakthrough and this breakthrough is confirmed by the formation of a bullish pattern.
And here we see a bullish pattern in the formation of a first red candlestick providing an initial indication of a potential stalled position. This would have been chosen as an exit point and a well-chosen exit point as gold shortly thereafter experienced a downtrend, eventually back towards the resistance level, which now acts as a potential new support level.
Conclusion
There are many different price action trading strategies that can be used to maximize profits. The strategies discussed in this blog post are just a few of the many that are available. By following the tips in this blog post, you can hopefully increase your chances of making profitable trades and minimizing your losses.

Disclaimer: All investments involve risk, and the past performance of a security, industry, sector, market, financial product, trading strategy, or individual’s trading does not guarantee future results or returns. Investors are fully responsible for any investment decisions they make. Such decisions should be based solely on an evaluation of their financial circumstances, investment objectives, risk tolerance, and liquidity needs. This post does not constitute investment advice.

Painless trading for everyone
Hundreds of markets all in one place - Apple, Bitcoin, Gold, Watches, NFTs, Sneakers and so much more.
Painless trading for everyone
Hundreds of markets all in one place - Apple, Bitcoin, Gold, Watches, NFTs, Sneakers and so much more.
Subscribe now to our newsletter to get critical insights and analysis: