Candlestick patterns are key indicators on financial charts, offering insights into market sentiment and price movements. These patterns emerge from the open, high, low, and close prices of a security within a given period and are crucial for making informed trading decisions. The aim is to identify potential market reversals or trends, helping you make better decisions and potentially increase your earnings.
This article not only serves as a comprehensive guide that explains how to identify and interpret candlestick patterns but also provides expert advice and insights from scientific studies on their effectiveness in trading strategies. After reading this guide, you will truly be equipped with the knowledge and practical know-how to effectively identify, interpret, and utilize patterns in your trading strategy.
To begin, watch the video below ⬇️ to gain a high level understanding of the power behind candlestick formations and why professional traders use them in their strategies.
Now, let's explore candlestick patterns, their formation, structure, and use in trading. To make your journey through this comprehensive guide more convenient, simply use the clickable navigation below to swiftly find the topics you're most interested in:
Author Biography: Steven Holm is a financial writer and former professional trader with many years of experience in financial markets specializing in commodities. His expertise extends to market analysis and strategy, grounded in a strong academic background in Finance and Economics. As a Senior Writer, Steven offers valuable insights through his clear and practical financial reports on all things trading. Beyond work, he has a keen interest in digital currencies and financial history.
Remember, successful trading involves more than pattern recognition. It requires trial and error, disciplined execution, risk management, and a reliable, low-fee trading platform like Morpher.
Morpher is a revolutionary trading platform built on the Ethereum blockchain. Users can trade stocks, forex, cryptocurrencies and unique markets such as luxurious watches and NFTs with maximum security and execution speed. It stands out with zero fees, infinite liquidity, shorting, and no counterparties, allowing for unrestricted trading.
Morpher offers the industry's most advanced and comprehensive candlestick charting tools for free, powered by Tradingview. This allows you to analyze market trends, build trading strategies, and execute trades, all in one place. So, if you're ready to excel in candlestick pattern trading, sign up on Morpher. It's quick, straightforward, and comes with no KYC hassle. Register now and get a free money bonus to start trading candlestick patterns instantly and like a Pro.
How Are Candlesticks Formed on a Trading Chart?
Candlesticks are like the X-ray vision of a market. You can see what's happening under the surface, like changes in a market’s strength and direction and how emotions shape the trends.
Each candlestick represents price information in a specific unit of time, such as one trading day in a daily chart, one hour in an hourly chart, and so on. By changing the time frame on a chart, the candlesticks will also change accordingly. Let’s look into the components of candlesticks next to understand how they form and what they represent.
Candlestick Components
The four components of a candlestick are the open, close, high, and low prices for a specific time period. Let’s look at an example of a daily candle:
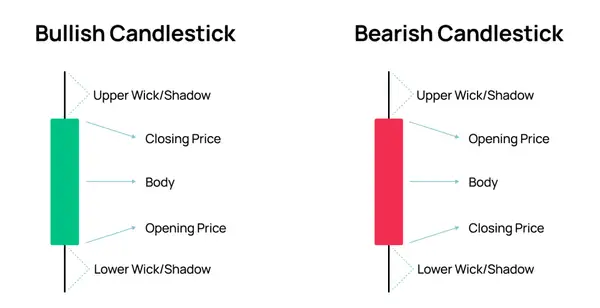
The Anatomy of a Candlestick
The open price is the first price at which the asset trades in one specific day.
The close price is the last price at which the asset trades in one specific day.
The high price is the highest price the asset reaches during the day.
The low price is the lowest price reached during the day.
The Candlestick Body
The area between the opening and closing prices is called the body. The color of a candlestick body indicates a bullish or bearish price movement. If the opening price is lower than the closing price, the body color is green. Conversely, if the opening price is lower than the closing price, the body color is red. Different platforms display different colors, but these are the most common.
The size of the candlestick body itself offers valuable information to traders. The longer the body, the more bullish or bearish the candlestick is. A very long red body indicates aggressive selling (fear), and a long green body indicates strong adoption (optimism) in a market.
Upper Shadow and Lower Shadow
Almost every candle has so-called shadows (or wicks). The thin line between the top of the body and the high of the trading period is called the upper shadow. And the line between the bottom of the body and the low is called the lower shadow.
The length and positioning of the shadows provide key indications of market behavior. When the upper shadow is relatively long, it suggests that prices were driven higher during the session but encountered selling pressure or profit-taking near the peak. This could signify potential resistance levels or bearish sentiment coming into play. Conversely, a short upper shadow may imply that buyers remained dominant throughout the session, indicating a strong bullish sentiment.
That’s all regarding the anatomy of candlesticks. Understanding how candlesticks form and what information they hold is essential in mastering candlestick patterns. Now that we covered this part, let’s continue exploring the most common bullish and bearish patterns.
Bullish and Bearish Candlestick Patterns
Bullish candlestick patterns indicate a higher probability of upward price movement. It typically suggests that buyers are in control, driving prices even higher. Bullish patterns often exhibit characteristics such as larger green bodies, long lower shadows, and short upper shadows. These patterns can signify a potential trend reversal, continuation of an existing uptrend, or the formation of a support level.
On the other hand, bearish candlestick patterns indicate a higher likelihood of downward price movement. It implies that sellers are exerting influence and driving prices lower. Bearish patterns often feature larger red bodies, long upper shadows, and short lower shadows. These patterns can suggest a potential trend reversal, continuation of a downtrend, or the formation of a resistance level.
Most Reliable Candlestick Patterns with Strategies
Before you start investing your hard-earned money in candlestick patterns, let's set some expectations straight. While these candle formations can help analyze the markets and make informed trading decisions, it's crucial to remember that they’re not a one-way ticket to easy profits. As Edwin Lefèvre wisely noted in ‘Reminiscences of a Stock Operator,' ‘Easy profits in the stock market are the bait on the hook that catches the mug.' This reminder serves as a caution against the allure of quick gains and underscores the importance of thorough analysis and strategy in trading.
In addition to explaining each pattern, we have developed comprehensive live trading strategies for every single one. For an in-depth exploration, simply click on the links within each pattern's description. These will guide you to detailed strategies for various scenarios, complete with predefined approaches and integration with other key indicators.
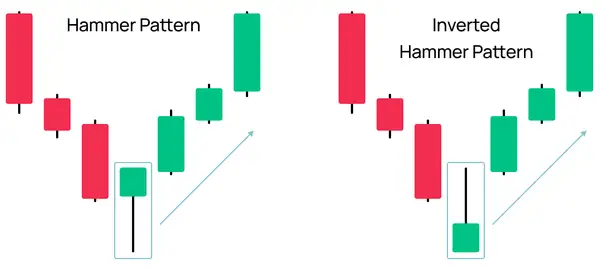
Hammer and Inverted Hammer
A hammer candlestick pattern is a bullish reversal pattern that is most accurate at the bottom of a downtrend. It signals that sellers are losing power and are being outnumbered by buyers. Traders look for the hammer pattern as a signal to buy, as it suggests that the price will likely rise in the near future.
The candlestick has a small body, a long lower shadow, and no upper shadow. Also, the lower shadow has to be longer in height than the candlestick’s body for the pattern to be valid. The color of the body of a hammer candlestick can be either green or red.
The inverted hammer pattern looks the same as the hammer pattern. The only difference is that it’s upside down. Despite being called “inverted,” it’s still a bullish reversal pattern. It indicates the end of a downtrend and a possible trend reversal to the upside.
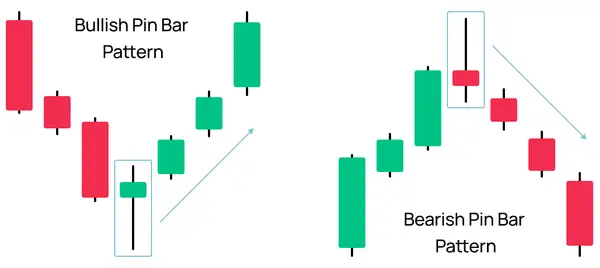
Pin Bar
The pin bar candlestick pattern is undoubtedly the most traded pattern out there, and it is for a good reason. This pattern is used by traders to identify possible trend reversals or continuations after a pullback. Its accuracy is significantly higher when it forms around key support and resistance levels, trendlines, and moving averages.
The bullish pin bar is characterized by a long lower shadow, with a small body and a relatively short shadow on the other end. The tail of the pin bar (the lower shadow) has to be at least two-thirds of the entire length of the candlestick for the pattern to be valid.
The bearish pin bar is the opposite of the bullish pin bar. It has a long upper shadow, a small body, and a short lower shadow. This rejection of higher prices signals that the market may be losing momentum and that a bearish reversal may come soon. Once a bearish pin bar is confirmed, traders look for short selling opportunities.
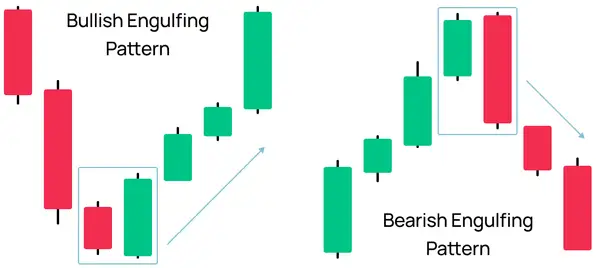
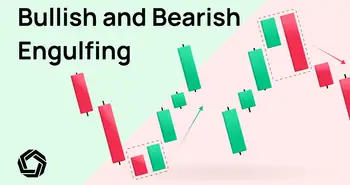
Engulfing
The engulfing candlestick pattern is one of the most common patterns used by traders to identify trend reversals and continuations after a pullback in the financial markets.
In a bullish engulfing pattern, the first candlestick is red, and the second one is green. The body of the green candlestick is much larger than the body of the red candlestick, with very little to no overlapping shadows. Also, the green candlestick has to open lower than the previous candlestick’s close and close higher than the previous candlestick’s high. The bullish engulfing pattern indicates that buyers have taken control, and the price will likely go up.
A bearish engulfing pattern is valid when a green candlestick is followed by a larger red candlestick. The exact opposite of a bullish engulfing pattern. The green candlestick must completely cover (or engulf) the previous candlestick. The pattern suggests that the bears have taken charge of the market and indicate a possible decline in price in the near future, so traders look for shorting opportunities.
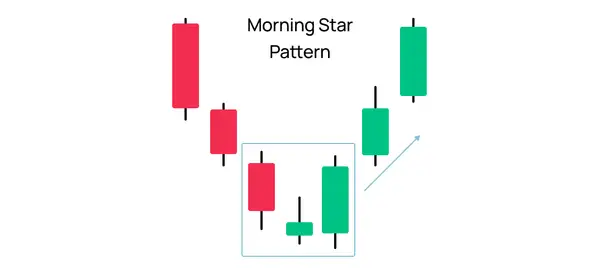
The Morning Star
The morning star pattern essentially implies the bullish state of the market, as the appearance of the morning star is just before sunrise. It is more accurate when it forms at the end of a downtrend. The morning star is a three-candlestick pattern:
The first candlestick is a bearish candlestick with relatively small shadows.
The second candlestick has a small green or red body and short shadows. This candlestick forms at the lower end of the first candlestick.
The third candlestick is a bullish candlestick that indicates strong buying pressure and a potential trend reversal. The body of this candlestick has to be at least the same size as the first candlestick or bigger.
Traders look for the morning star pattern as a signal to buy, as it suggests that the price will likely rise soon.
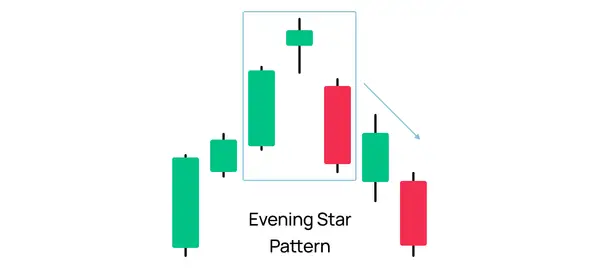
The Evening Star
The evening star pattern is the upside-down version of the morning star pattern. It indicates the reversal of an uptrend into a downtrend. The three candlesticks are characterized as follow:
The first candlestick is a bullish candlestick with relatively small shadows.
The second candlestick has a small green or red body and short shadows.
The third candlestick is a bearish candle, and the body is bigger than the first one (or at least the same size).
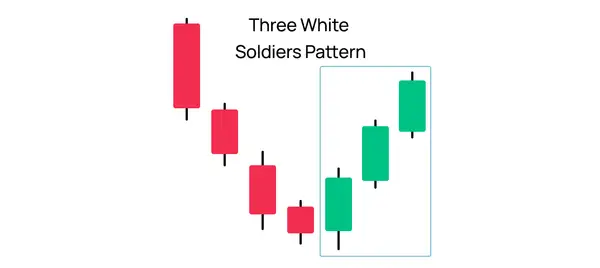
Three White Soldiers
The three white soldiers pattern is a bullish reversal pattern consisting of three green candlesticks with small shadows. This pattern is more reliable when it forms in a downtrend that has been developing for a longer period of time.
For this pattern to be valid, each candlestick has to open near the previous candlestick’s close price.
Traders and analysts often interpret this pattern as a signal to enter long positions or add to existing ones, expecting further price gains.
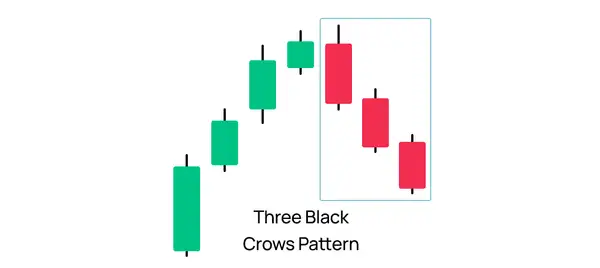
Three Black Crows
The three black crows pattern is a bearish reversal pattern that is more accurate when it forms at the end of an uptrend. Think of it as an upside down three white soldiers pattern.
This pattern is formed by three consecutive bearish candlesticks. The opening of each candlestick occurs at the previous candlestick’s closing price, and the closing price is lower than the opening price. The three black crows pattern is particularly significant when it occurs at higher price levels or after a mature advance, indicating a potential decline in prices.
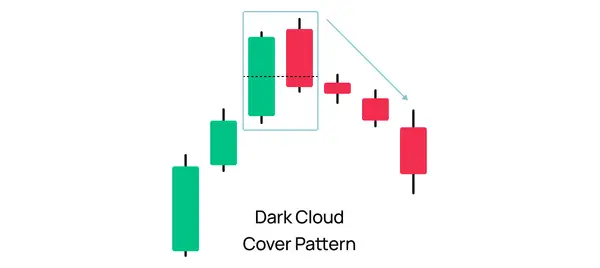
Dark Cloud Cover
The dark cloud cover “phenomenon” signals the potential end of an uptrend. It is a two-candle pattern where the first candle is a long green candlestick, followed by a long red candlestick that opens above the previous candlestick's close. During its trading period, the price starts to decline significantly and the red candlestick closes below the midpoint of the first candlestick's body.
This pattern suggests that the sunny days of the current uptrend are coming to an end. Bulls are losing control, and the bears are taking over.
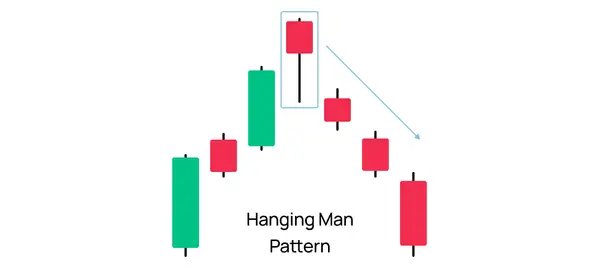
Hanging Man
The hanging man pattern is a bearish signal. The shape of the Hanging Man candlestick resembles a person hanging by their feet, hence the name. It typically occurs after an uptrend in the market and suggests that the bullish momentum may be weakening or reversing. The hanging man candlestick has a small body positioned at the top of the candle and a long lower shadow. The lower shadow must be at least twice as long as the candle’s body, and there must be a small or no upper shadow.
Doji
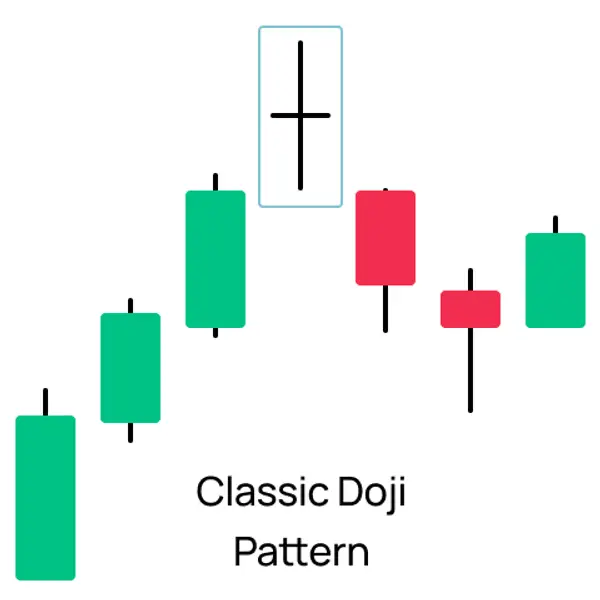
The term “doji” in Japanese translates to “the same thing,” and it refers to the candlesticks with the open and close prices more or less the same. The length of the upper and lower shadows can vary.
A classic doji pattern is a candlestick pattern that indicates indecision and uncertainty in the market. The pattern indicates that neither the buyers nor sellers are in control and that the market is in a state of equilibrium. Traders interpret the presence of a doji pattern as a signal to exercise caution and await further confirmation or additional information before making any decisive buying or selling decisions.
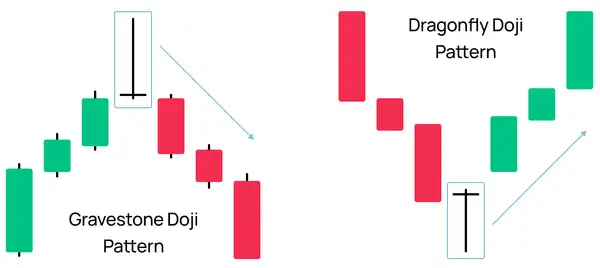
There are different types of doji patterns, including the classic doji (which was described above), gravestone doji, and dragonfly doji. Each type of doji pattern has its own unique characteristics and interpretation.
Gravestone doji and dragonfly doji are very similar to the bearish and bullish pin bar patterns except for the size of the body. A doji candlestick has no body, meaning that the opening and closing prices are virtually the same, while a pin bar possesses a small body. In general, pin bars are more reliable than gravestone or dragonfly doji candlesticks.
Harami
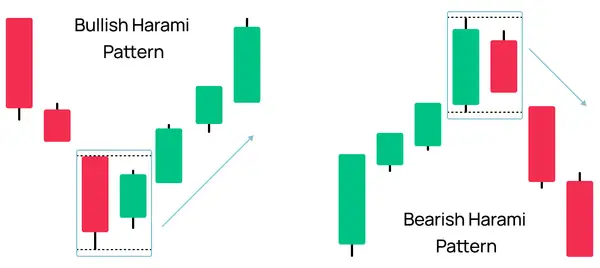
The word “Harami” in Japanese means “pregnant.” The term represents the pattern’s appearance, which resembles a pregnant woman’s body with a small candlestick “inside it.” Don’t judge. I didn’t come up with this name.
The harami pattern is formed by two consecutive candlesticks. The first candlestick has a long body and small shadows. The second candlestick is a small candle with a body that is entirely inside the previous candlestick’s body.
In an uptrend, the harami pattern will have the first candlestick green and the second candlestick red. This indicates a possible trend reversal.
Likewise, in a downtrend the first candlestick is red, and the second one is green—a good time to look for buying opportunities.
Marubozu
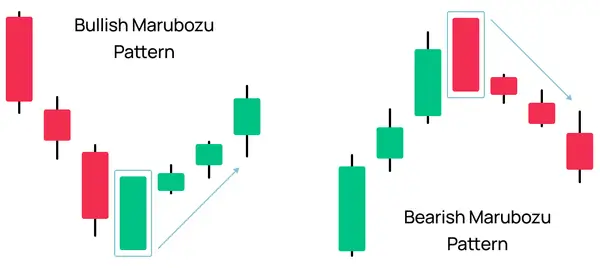
The term marubozu means “bald head” or “shaved head” in Japanese. The Marubozu pattern is a candlestick with a long body with no shadows. It can either be bullish or bearish depending on its color and is the most accurate in trend continuations after pullbacks.
A bullish marubozu is a long green candlestick with no upper or lower shadow. This candlestick indicates that buyers controlled the market price from the open to the close, suggesting a strong bullish sentiment.
A bearish Marubozu is the opposite of a bullish Marubozu. The candlestick has a long red body with no upper or lower shadow, indicating that the price opened at its high and closed at its low. This suggests that the bears were in complete control of the market and that selling pressure remained strong throughout the session.
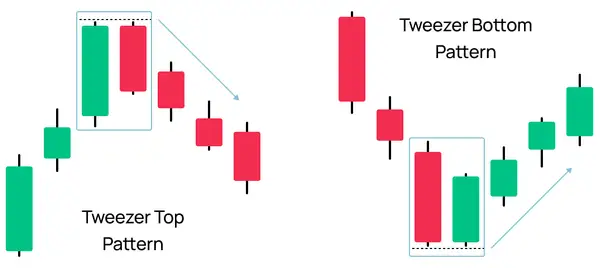
Tweezer Top and Bottom
The tweezer pattern is a short-term reversal pattern and it forms when two candlestick bodies have the same highs (in an uptrend) or lows (in a downtrend). This pattern indicates a struggle between buyers and sellers and can signal a potential trend reversal.
In a downtrend, the pattern is called tweezer bottom, and requires two consecutive candlestick bodies of either color to reach the same low point. This formation indicates that buyers are entering the market, as they were able to push the price back up from the low reached by the first candlestick.
When the market is in an uptrend, traders refer to the pattern as a tweezer top and it requires two consecutive candlesticks to have the same highs to be considered valid. This pattern signals a shift in market momentum and a potential trend reversal as bears begin to take control of the market.
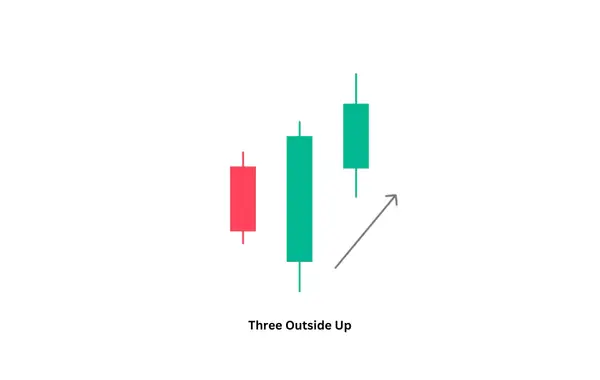
Three Outside Up
The Three Outside Up pattern made its mark on Bitcoin’s chart in 2024, reinforcing its reputation as a strong bullish reversal signal. As we update our guide for 2025, this pattern remains an essential tool for traders looking to identify shifts in market momentum. Its effectiveness lies in its ability to confirm the transition from bearish to bullish sentiment, making it particularly useful in volatile markets.
The pattern begins with a small bearish candlestick, indicating initial selling pressure. The second candlestick, a large bullish one, completely engulfs the first, signaling a shift in market control. This is followed by a third bullish candlestick that closes even higher, confirming the reversal. When this formation appears at key support levels, it becomes a high-probability setup for traders looking for long entries.
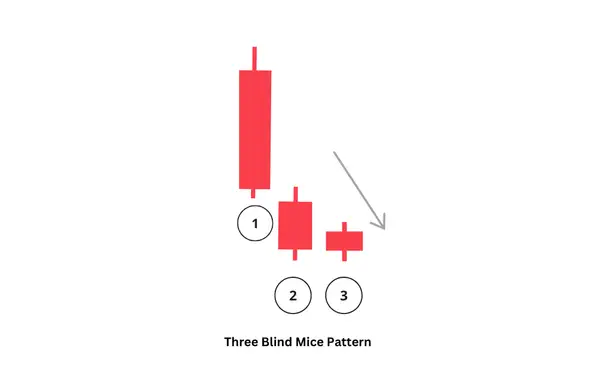
Three Blind Mice Pattern
A relatively new but intriguing formation, the Three Blind Mice pattern captured the attention of traders in 2024 when it emerged on Bitcoin’s chart. Its presence in high-profile analyses, particularly by veteran trader Peter Brandt, fueled discussions around its potential significance. Given its impact on market sentiment last year, we have added it to our 2025 list as a pattern worth monitoring for bullish reversals. If you want to learn more about how to use this pattern in your strategy, read our full guide on Three Blind Mice pattern.
This pattern consists of three consecutive bearish candlesticks, each progressively smaller than the last, resembling a gradual loss of selling momentum. The shrinking candle size suggests that bears are weakening, creating conditions for a potential bottom. Traders typically look for confirmation through a subsequent bullish breakout, which often follows as buying pressure builds. While not yet as established as classic reversal patterns, its performance in 2024 warrants its inclusion in this updated guide.
Candlesticks Research Papers: Case Studies from Actionable Market History
Now that we know the basics, an important question arises: Are candlestick patterns a scientifically proven method or just another fleeting “get-rich-quick” scheme? To tackle this mystery, we've collected numerous case studies and research publications, showing you what scholars have discovered.
Findings of Four Candlestick Pattern Research Papers
For example, A study by trading experts examining Taiwan's Stock Exchange and Japan's Nikkei 225 found that integrating candlestick patterns with advanced analytical models significantly boosts the accuracy of market predictions.
In another groundbreaking study applying deep learning techniques to the NIFTY50 index, experts found significant potential in candlestick patterns for predicting bullish market trends. This research, led by top financial scholars, provided a scientific backing to the use of these patterns in volatile markets like India.
Another compelling study, endorsed by seasoned financial experts, successfully translated candlestick patterns into practical, profitable trading strategies. These strategies, when tested against real-market data, consistently outperformed traditional methods, confirming the practical utility of candlestick analysis.
However, an extensive literature review conducted revealed a critical insight: while candlestick patterns are popular among traders, there's still a noticeable lack of empirical research in reputed journals. This gap, identified by leading academics, suggests a rich opportunity for future scholarly exploration.
Results of Studies on Candlestick Patterns
The collective insights from these studies paint a clear picture: candlestick patterns are more than just a trading fad. They possess a scientifically proven edge, which, when combined with modern technologies, can be harnessed to enhance trading effectiveness even more.
So, candlestick patterns are reliable for trading but you have to know their limitations and how to overcome them. And this can only be achieved through practice, practice, practice.
Learning to recognize a pattern doesn’t mean you’ll also be successful with it. There’s much more to trading than just patterns—such as knowing exactly when to enter and exit a trade after a chart pattern is completed or what risk-reward ratio is the most suited for your trading style.
By analyzing trading patterns on historical data, you will find out which patterns work the best with your strategy. Accuracy will differ based on which asset you want to trade, the indicators used in the analysis, and which time frame you use for analysis.
In general, trading patterns are more reliable on higher time frames such as 1-hour, 4-hours, or daily. This is because there is more market noise on lower time frames, and patterns tend to fail more often. One way to filter through the noise and increase accuracy is to use patterns in combination with other technical indicators such as moving averages, relative strength index, macd, or bollinger bands.
Expert Candlestick Advice: Opinions from Pattern Trading Legends Steven Nison and John J. Murphy
In our “Expert Insights” section, we delve into the wisdom of Steven Nison and John J. Murphy, renowned for their mastery in candlestick charting.
Steven Nison’s Insights on Candlestick Pattern Trading
Nison, known as the pioneer who introduced candlestick patterns to the Western world, emphasizes understanding the fundamentals of candlesticks, highlighting their ability to reveal market psychology and the balance of power between bulls and bears. He advocates for the careful analysis of patterns like doji, which signify market equilibrium, and stresses the importance of recognizing early reversal signals to avoid poor trades.
“Each candlestick is a simple, yet powerful tool to understand what's happening in the market”
Steve Nison
John Murphy’s Experience with Candlestick Patterns
John J. Murphy, the expert in technical analysis, complements these insights by advising on the integration of candlestick patterns with other technical tools. His concept of ‘candle pattern filtering' is particularly noteworthy, underscoring the significance of identifying market trends to enhance the predictive ability of candle patterns. Murphy's approach focuses on combining candlestick analysis with traditional technical indicators for a more robust trading strategy.
Combined Insights from Candlestick Experts
To create a practical trading strategy combining the approaches of Steven Nison and John J. Murphy, you could:
Identify Candlestick Patterns: Use Nison's techniques to identify key candlestick patterns like doji, signaling market exhaustion, or reversal patterns. This would help to understand the current market sentiment.
Apply Candle Pattern Filtering: Integrate the concept of Greg Morris that Murphy introduced about the concept of candle pattern filtering by assessing the overall market trend and overbought or oversold conditions using traditional technical analysis tools.
“A revolutionary concept developed by Greg Morris in 1991, called candle pattern filtering, provides a simple method to improve the overall reliability of candle patterns. While the short-term trend of the market must be identified before a candle pattern can exist, the determination of overbought and oversold markets using traditional technical analysis will enhance a candle pattern’s predictive ability. Concurrently, this technique helps eliminate bad or premature candle patterns.”
John Murphy
Combine with Technical Indicators: Enhance the strategy by including indicators such as MACD or RSI to confirm the signals suggested by candlestick patterns.
Risk Management: Follow a disciplined approach in setting stop-loss orders and profit targets based on the confluence of candlestick patterns and technical indicators, ensuring risk is managed effectively.
Continuous Learning and Adaptation: Regularly review and adjust the strategy to adapt to changing market conditions, as advised by both experts.
Frequently Asked Questions (FAQ)
Do chart patterns work in all financial markets?
Yes. Patterns can be identified in any financial market, but their reliability differs due to market players, volatility, timeframe, and trading strategy.
This is why it’s important to backtest your strategy on historical data and find out which markets are performing the best based on your trading rules.
What is the most accurate candlestick pattern?
The accuracy of a candlestick pattern can vary based on market conditions and the context in which it appears. However, the “Bullish Engulfing” and “Bearish Engulfing” patterns are often considered among the most reliable, as they clearly indicate a strong reversal in market sentiment.
What is the most powerful candlestick pattern?
The “Hammer” and “Inverted Hammer” (for bullish reversals), and the “Shooting Star” and “Hanging Man” (for bearish reversals) are typically seen as powerful candlestick patterns. Their power lies in their ability to signal a potential change in market direction with relatively high accuracy.
What is the 3 candle rule?
The 3 candle rule refers to a trading strategy that looks for a pattern of three consecutive candlesticks as a signal for entering or exiting a trade. This could be, for example, three successive candles closing higher in an uptrend or lower in a downtrend, used as a confirmation for trend continuation.
Do professional traders use candlestick patterns?
Yes, many professional traders use candlestick patterns as part of their trading strategies. These patterns help them to interpret market sentiment, identify potential reversals, and make informed decisions about entry and exit points. However, it's common to use them in conjunction with other forms of analysis for a more comprehensive approach.
For which type of trader candlestick patterns work the best?
Patterns form in every timeframe, so they can be profitable for all kinds of traders. Day traders usually trade patterns more aggressively with less confirmation as they prefer to get in and out of a trade as quickly as possible.
Position traders hold trades longer than a day and use patterns to identify the long-term direction, and they usually trade more conservatively, with more confirmation. If the trade goes wrong, they are out quickly. If it is profitable, they stay in the market and aim for a big winner.
How can I combine candlestick patterns with other technical analysis tools?
Candlestick patterns are a cornerstone of technical analysis. However, to achieve a robust trading strategy, integrating them with other technical tools is crucial. Think of candlesticks as the “raw data” of a company's performance report, while other tools represent the analysis and insights. You need both to maximize your profits.
Moving Averages: This tool helps smoothen out price data. When a candlestick pattern forms near a significant moving average line, such as the 50-day or 200-day, it adds conviction to the pattern's implications. For example, a pin bar forming right at the 50-day moving average might indicate a stronger potential reversal compared to one that forms elsewhere.
Volume: As the saying goes, “Volume is the fuel that drives the market engine.” A bullish candlestick pattern combined with a spike in volume can reinforce the strength of the potential upward movement.
Bollinger Bands: These bands act as dynamic support and resistance levels. If a bullish candlestick pattern forms just as the price touches the lower Bollinger Band, it could be an indication of an upward swing.
Fibonacci Retracements: Ever noticed how nature follows specific patterns and ratios? The same applies to trading. Leonardo Fibonacci, the mathematician, revealed a sequence that is now used to predict potential support and resistance levels in the market. A bullish candlestick pattern forming around a major Fibonacci retracement level (like 61.8%) can enhance the conviction behind a potential upward move.
Trendlines: The fundamentals of charting, trendlines represent the broader direction in which the market moves. A candlestick pattern that forms in conjunction with a trendline break or bounce can provide a strong directional cue.
In the words of the esteemed trader Jesse Livermore, “The game of speculation is the most uniformly fascinating game in the world. But it is not a game for the stupid, the mentally lazy, the person of inferior emotional balance, or the get-rich-quick adventurer.”
True mastery in trading emerges from a deep understanding and integration of various technical tools, with candlestick patterns serving as the foundation upon which this sophisticated structure is built.
Are there certain market conditions where candlestick patterns are more effective?
Absolutely. Candlestick patterns thrive in specific market conditions. Recognizing these conditions is the same to understanding the seasons — one wouldn't wear summer clothes in winter, would they? Similarly, the efficacy of candlestick patterns varies depending on the broader market climate.
Volatility: In periods of high volatility, the relevance of candlestick patterns intensifies. They serve as a visual representation of the tug-of-war between buyers and sellers. Especially during significant news events or earnings reports, the patterns that emerge can offer sharp insights into market sentiment.
Consolidation Phases: Markets, like nature, have their moments of quiet. During these quiet times, the market moves sideways, exhibiting little to no trend. It's during these phases that breakout patterns like pin bars or engulfing become particularly telling. They hint at the forthcoming storm after the calm, signaling potential breakouts or breakdowns.
Strong Trending Markets: The momentum of a powerful trend, be it bullish or bearish, is a sight to behold. Candlestick patterns here act as mile markers. Continuation patterns, such as the bullish marubozu in an uptrend or the bearish engulfing in a downtrend, can reaffirm the current momentum, guiding traders to ride the wave.
Key Support and Resistance Zones: These are the battlegrounds of the trading space, where the forces of supply and demand clash. When candlestick patterns form at these strategic frontlines, their implications are magnified. A hammer pattern at a key support or an evening star pattern at a resistance might very well be the trumpet call signaling a change in the tide of the battle.
Market Openings: The beginning of a trading session is often filled with anticipation. Patterns that form during the first hour can set the tone for the rest of the session. However, it's crucial to differentiate between genuine signals and the market's morning anxiety.
Recall the wisdom of the legendary Bruce Lee, who once said, “Be water, my friend.” Markets, too, flow like water, adapting and reshaping with the terrain. Recognizing the conditions and contexts in which candlestick patterns form is akin to understanding the flow of this water, guiding one to navigate the market streams more adeptly.
How do professional traders use candlestick patterns in their trading strategies?
Traders integrate candlestick patterns into their trading strategies in multiple ways:
Entry Points: A bullish reversal pattern at a support level can act as an entry cue.
Stop Loss Setting: Bearish patterns can help in determining where to place a stop loss.
Profit Taking: Spotting a bearish reversal pattern after a prolonged uptrend might signal taking profits off the table.
Consider them as signposts on the trading journey, guiding your decisions.
Can candlestick patterns be applied to all time frames, such as daily, hourly, and minute charts?
Short answer: Yes. But does the effectiveness vary? Indeed, it does. Daily charts offer a holistic view of market sentiment, often reducing noise. Patterns on these charts are usually more reliable. On the other hand, while hourly and minute charts can provide real-time insights, they can also be riddled with false signals.
Just as a clock's ticking second hand doesn't give the full essence of time as its hourly counterpart, it's crucial to discern the weight of patterns across different time frames.
What are the potential pitfalls or misconceptions about trading based solely on candlestick patterns?
Modern traders understand that relying solely on candlestick patterns has its caveats. Let's demystify some of the common pitfalls and misconceptions.
Isolation versus Integration: As mentioned before in this article, while candlestick patterns offer a wealth of information, using them in isolation, without the seasoning of other technical or fundamental tools, might leave a strategy wanting. Integration, not isolation, is key.
Pattern Overconfidence: The formation of a clear pattern such as a morning star or a three white soldiers can sometimes look like a perfect trade opportunity. But it's vital to remember: No pattern, however prominent, guarantees a particular outcome. A bullish engulfing might suggest an uptrend, but what if it's just a minor pullback in a larger bear market? Always study and backtest your strategy to gain as much information and confidence as possible. It’s completely fine to skip trading a candlestick pattern if the macro analysis is not aligned with your setup.
Ignoring Volume: As any seasoned trader would tell you, “Candlesticks show the direction, but volume narrates the story.” An bullish engulfing candlestick pattern without a surge in volume might lack the conviction of an uptrend move and may develop in a consolidation phase.
Overanalysis Paralysis: In the vast realm of candlestick patterns, there's a pattern for almost every price action. The pitfall? Getting caught in overanalyzing every formation. Searching for perfection in patterns can lead to missed opportunities. Remember, sometimes the music is in the pauses.
Conclusion
Congratulations on reaching the end of this comprehensive guide! You've taken an important step towards gaining an edge in the markets. Remember, trading with candlestick patterns through diligent practice, integrating robust risk management, and learning from each trade. Success in trading is a journey of continuous skill enhancement, balancing pattern recognition with effective capital preservation strategies and embracing every experience as a valuable lesson. But knowledge alone isn't enough; you need the right platform to apply it. That's where Morpher comes in. With its advanced technology and user-friendly interface, Morpher is the ideal platform for both novice and experienced traders to put candlestick strategies into practice.
Why wait? Sign up for Morpher now and start trading with the advantage of cutting-edge tools and insights and No KYC. Dive into a world of trading possibilities – from stocks and forex to cryptocurrencies and beyond. With Morpher's intuitive platform, you're not just trading; you're trading smarter, faster, and with greater potential for success.
Transform your trading journey today. Register on Morpher, and you'll receive a special bonus to kickstart your trading with candlestick patterns. Trade, analyze, and grow with Morpher – where every trader gets to shine. Your future in trading candlestick patterns successfully begins now!
Painless trading for everyone
Hundreds of markets all in one place - Apple, Bitcoin, Gold, Watches, NFTs, Sneakers and so much more.
Painless trading for everyone
Hundreds of markets all in one place - Apple, Bitcoin, Gold, Watches, NFTs, Sneakers and so much more.
Subscribe now to our newsletter to get critical insights and analysis: