
Pin bar patterns are among the most powerful and easily recognizable price action signals on candlestick charts. The pattern consists of just one price bar and it indicates a sharp reversal and rejection of price.
When combined with other reliable technical analysis tools like trendlines, moving averages, and oscillators, pin bars can help you gain an edge in the markets and achieve consistent profits.
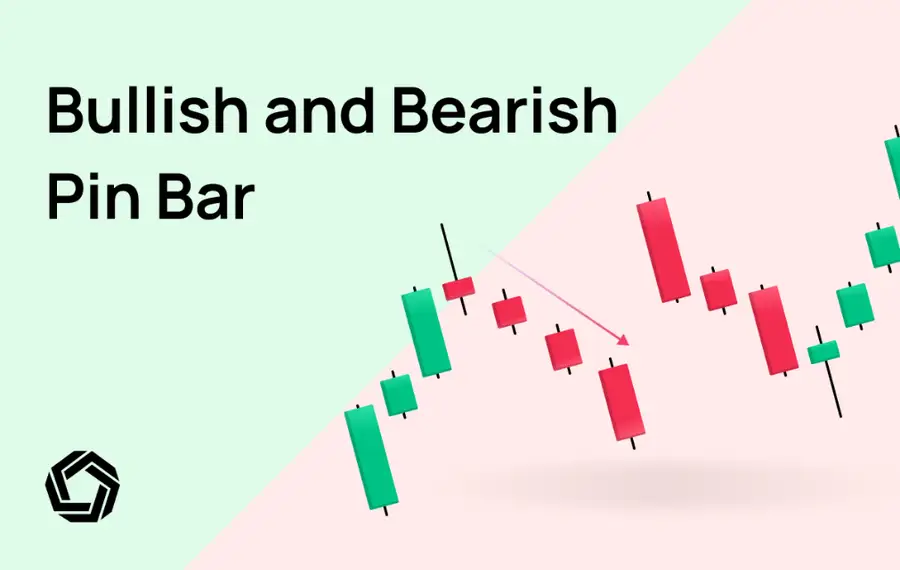
In this article, we'll explore both bullish and bearish pin bar patterns and how to trade them effectively.
Bullish Pin Bars
A bullish pin bar pattern is a candlestick pattern that signals a potential bullish reversal in the market. This pattern is characterized by a single candlestick with a small body that can be either red or green, a long lower shadow, and a short upper shadow. The length of the lower shadow must be at least two-thirds of the entire length of the candlestick.
The long lower shadow of a bullish pin bar indicates that the price dropped significantly during the trading period of the candlestick, but was then rejected at this lower level and was pushed back up. This rejection of lower prices suggests that the market sentiment has shifted and that buyers are likely to enter the market.
Traders often look for additional confirmation of the bullish pin bar pattern before taking a long position, such as a break above a key resistance level or a bullish crossover of technical indicators.
What Does a Bullish Pin Bar Pattern Look Like?
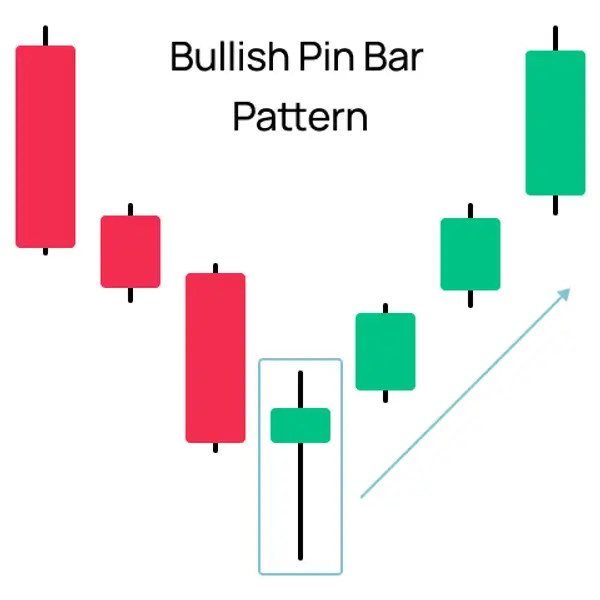
For a bullish pin bar pattern to be valid, the following conditions must be met:
- For reversal signals, the preceding trend should be a downtrend with higher lows and lower lows.
- For trend continuation signals, the preceding trend can be either an uptrend or downtrend.
- The previous and subsequent candlestick after a bullish pin bar formed, should not touch the low price of the pin bar candlestick. While this condition is not commonly used, I highly recommend taking it into consideration to avoid false signals.
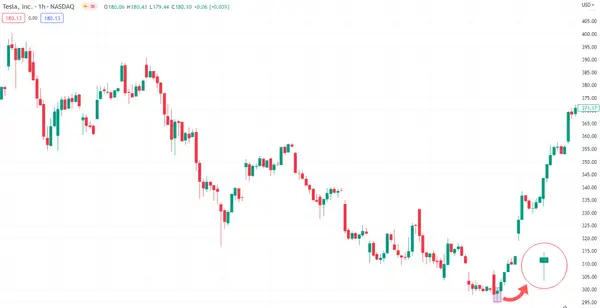
Below is a great example of a green bullish pin bar that formed at the end of a downtrend on the 1H TSLA stock and indicated a sharp trend reversal. As you can notice, the previous and subsequent candlesticks’ low prices are well above the pin bar’s low price.
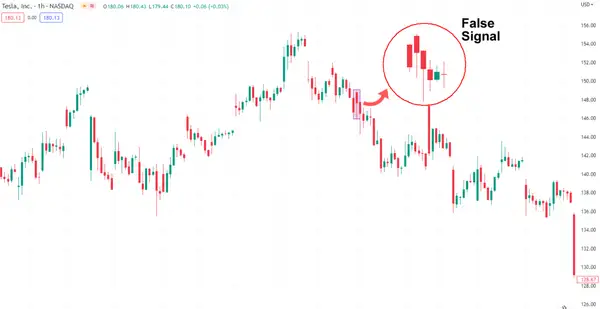
And here is an example of a false signal of a bullish pin bar pattern on 19 October 2020. The preceding trend is an uptrend so a bullish pin bar in this case should signal a trend continuation on the upside. However, the following candlestick’s price went below the pin bar’s low and therefore invalidated the signal.
Bearish Pin Bar
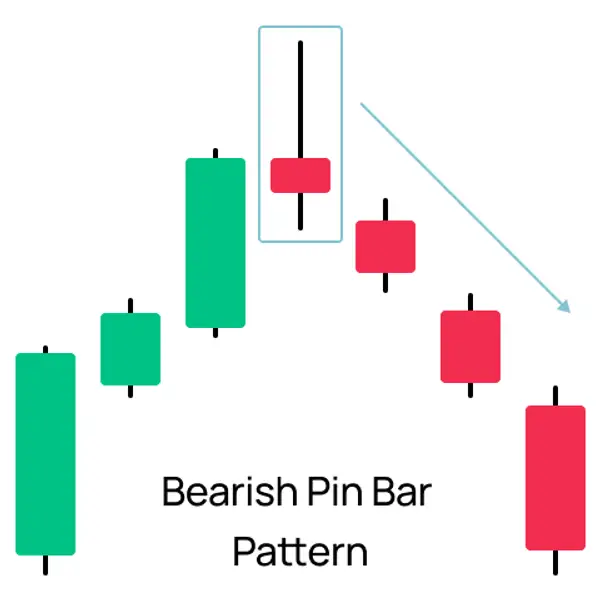
The bearish pin bar pattern is the opposite of the bullish pin bar pattern and it indicates a potential bearish reversal in the market. A bearish pin bar pattern consists of a single candlestick with a long upper shadow, a small body, and a short shadow on the other end.
The long upper shadow of a bearish pin bar indicates that the price rose significantly during the trading period of the candlestick, but then encountered selling pressure and was pushed back down. This rejection of higher prices signals that the market may be losing momentum and that a bearish reversal may come soon. Once a bearish pin bar is confirmed, traders look for short selling opportunities.
What Does a Bearish Pin Bar Pattern Look Like?
To confirm the validity of a bearish pin bar pattern, you should consider the following conditions:
- For reversal signals, the preceding trend should be an uptrend characterized by a sequence of higher highs and higher lows.
- For trend continuation signals, the preceding trend can be either an uptrend or a downtrend.
- The high price of the bearish pin bar candlestick should not be reached by either the preceding or subsequent candlesticks. It is important to consider this rule to avoid false signals.
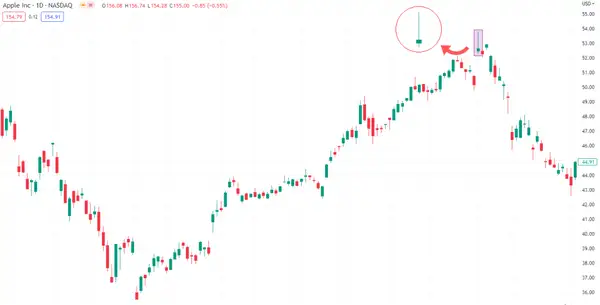
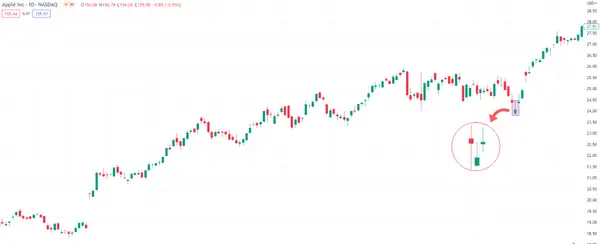
A great example of a bearish pin bar pattern can be seen on the APPL stock on 1st of May 2019. The pattern formed after a preceding uptrend, as the price encountered a significant level of selling pressure and resulted in the formation of a pin bar at the end of the trading session. A great opportunity to short sell APPL here.
A good example of classic false signal from a bearish pin bar can be seen on the APPL stock on 16 October, 2014 (see chart below). The appearance of the bearish pin bar suggested a potential reversal signal of a preceding uptrend, which may have led traders to consider entering a short position which would result in a lost trade.
So, how can we identify a false signal? It's relatively simple – if you look at the preceding or subsequent candlesticks you will notice that both of them reached the high price of the bearish pin bar, rendering the signal of a trend reversal invalid. Traders should take this as a cautionary reminder that while candlestick patterns can provide valuable insights, it's crucial to consider the broader market context and other technical indicators to make informed trading decisions.
Pin Bar Strategy Ideas
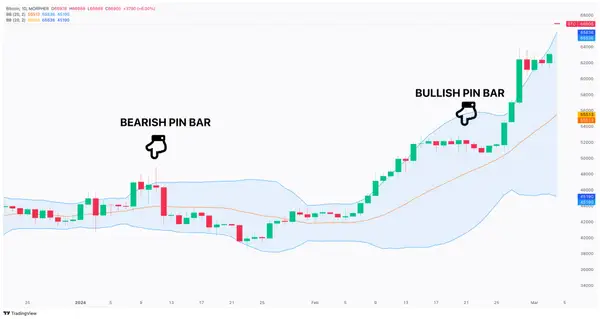
Pin bar patterns play a pivotal role in analysing price movements, offering invaluable insights into market dynamics. Notably, the appearance of a bearish pin bar pattern on BTC/USD daily chart at the $46,558 level on January 13, 2024 preceded a visible decline in BTC's valuation. This pattern indicated a potential reversal in the bullish momentum, suggesting that selling pressure might intensify, driving prices downward.
On February 21, a bullish pin bar pattern at the $52,121 level indicated a shift towards a more positive sentiment in BTC's price movement. This pattern suggested a rise in purchasing interest, which could push prices up and start an upward trend. To sum up, these pin bar patterns can serve as important indicators for your trading strategy, providing signals for potential changes in market direction. By recognising and understanding these patterns, investors can make more informed decisions about when to enter or exit trades.
It is important to note, however, that pin bar patterns are just one tool in a trader's arsenal and should be used in conjunction with other technical analysis indicators for a more comprehensive trading strategy. The most important thing to consider when trading candlestick patterns, especially pin bars, is to watch for false signals. Pin bar patterns are the most reliable when used to predict sharp reversals in price, and to make sure you don’t follow the wrong pin bar pattern, looking for confirmation with other technical analysis tools is a must.
With Morpher's comprehensive TradingView-powered price charts, you can examine these patterns in detail and seamlessly combine them with over 100 other technical indicators, empowering you to make well-informed decisions at the right time in your trading strategies. Sign up now and get ready to witness the power of candlestick patterns for yourself, complete with your sign-up bonus!
Now, if you are ready to start, here are some helpful tips to consider when trading pin bars:
- As a beginner, wait for additional confirmation before entering a trade based on a pin bar pattern. It's important to avoid trading every single pin bar that appears on a chart as this can result in unnecessary losses.
- The length of the upper shadow on a bearish pin bar and lower shadow on a bullish pin bar can provide valuable information about the strength and significance of the price reversal and rejection. Generally, longer shadows tend to be more reliable and suggest a stronger shift in market sentiment.
- When trading pin bars, the daily chart is often the most effective timeframe to use. This allows you to identify significant price levels and trends, and helps to filter out noise and false signals that can occur on shorter timeframes.
Strategy 1: Bearish Pin Bar and Resistance
Pin bars can be particularly effective when used in conjunction with support and resistance levels. In this strategy, we will use bearish pin bars with support and resistance levels to help identify high probability trading opportunities.
Trading rules
- Identify a resistance level.
- Identify bearish pin bar pattern.
- The high price of the bearish pin bar candlestick should not be reached by either the preceding or subsequent two candlesticks.
- Go short at the close of the second subsequent candlestick.
A resistance level is a price point or range that an asset cannot break above. It is an area where the selling pressure is stronger than the buying pressure, causing the price to go back down. Resistance levels occur in any market and any timeframe. The way you can easily identify a resistance level is by connecting two or more price peaks that occur at a similar level on a chart. In our scenario, a resistance level was identified on the EUR/USD pair by connecting three main price peaks where price failed to break above.
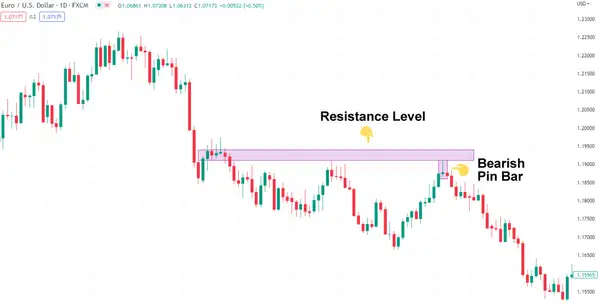
Then, a bearish pin bar formed right at the resistance level, indicating that buyers were losing their momentum and becoming less inclined to purchase the asset at higher prices.
The final condition before considering a short sell in this case is to make sure the previous and preceding candlesticks don’t reach the resistance level.
While some aggressive traders may short sell immediately after the bearish pin bar formation, I recommend waiting for additional confirmation, such as one or two more bearish candlesticks, to increase the probability of a profitable trade.
Strategy 2: Bearish Pin Bar and Trend Continuation
This is a trend-following strategy that involves using a bearish pin bar pattern as a confirmation signal to trade in the direction of the prevailing trend. In our scenario, we are looking at the BTC/USDT hourly chart.
Trading rules
- Prevailing trend has to be a downtrend
- A pullback
- Bearish Pin Bar pattern
- Go short below 200 Exponential Moving Average (EMA)
In our current scenario, BTC is in a clear downtrend characterized by a series of higher lows and lower lows. The recent drop in price has also caused it to dip below the 200 EMA, indicating a continued downward trend might be on the way.
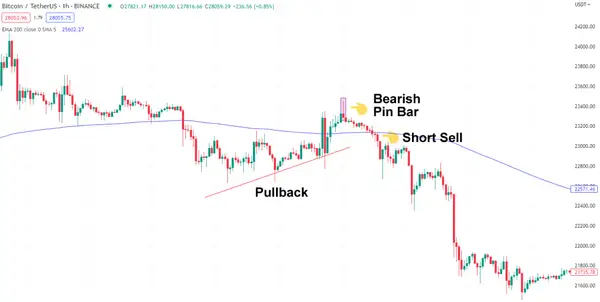
Following a brief pullback, a bearish pin bar has formed, with a long upper shadow and a very small lower shadow. This pattern suggests a potential price drop, but there is one more condition to be met before considering a short sell here.
To short sell BTC, the price has to fall below the 200 EMA. Once this criterion is satisfied, we can confidently proceed to short BTC and capitalize on the potential profits.
To minimize potential losses, a stop loss order can be placed just above the pin bar candlestick, with a target profit of at least 5 times the amount of the stop loss.
In our example, the trend played out perfectly well, but keep in mind that not all trades will be successful so you need to make sure you are using a stop loss and proper risk management.
Strategy 3: Pin Bars and Range Trading
Range trading is a strategy that involves buying or selling an asset when the price is within a certain range and then closing the position when the price approaches the upper or lower limits of the range. This type of trading aims to take advantage of the predictable price movements that occur within the specific range.
One of the main challenges in range trading is determining the optimal time to enter a trade. However, the pin bar pattern is widely considered to be one of the most dependable patterns for range trading. Here is one powerful strategy that you can add to your arsenal:
Trading rules
- Identify a range-bound market where the asset price has been trading within a specific range for a while.
- Look for bearish pin bar patterns that form near the upper limit of the range, indicating a potential reversal to the downside.
- When you see a bearish pin bar pattern, sell the asset when the price breaks below the low of the pattern. You can set a stop-loss order above the high of the pin bar to cut losses short.
- Take profit when the price reaches the lower limit of the range or when a bullish pin bar pattern forms, indicating a potential reversal to the upside.
- If the price breaks above the upper limit of the range, you should consider exiting the trade to avoid potential losses.
Here's an example of how this strategy can be applied on a live chart. Between 5 March, 2023 and 7 March, 2023 we identified a range on the BTC/USDT 15M chart, where the price bounced between the upper and lower limits of the range.
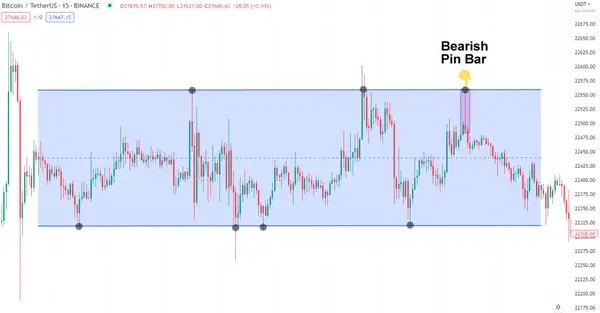
On 7 March, a bearish pin bar pattern formed, which signaled a significant price rejection from the upper limit of the range. This was a clear indication to enter a short position on BTC. With a stop-loss order placed somewhere above the upper limit of the range, this trade would be a big winner.
Best Platform to Trade Candlestick Patterns
When trading candlestick patterns, having the right platform is crucial to success. Here are some key factors to consider when choosing the best platform:
- Maximum Flexibility: Look for a platform that allows you to go long or short on any asset and use leverage to profit from even the smallest signals in any direction.
- Variety of Assets: A good platform should offer a diverse range of assets to trade from, including stocks, cryptocurrencies, commodities, forex, and unique markets. This ensures you can always find useful patterns and profitable markets to trade.
- Great Indicators and Advanced Chart View: The platform should have great indicators and an advanced chart view that allows you to save templates you have created and combine multiple indicators to get the best edge possible.
- Infinite Liquidity: Choosing a platform with infinite liquidity is important, so you can close every position at the exact price you aimed for and have no slippage.
- Zero Fees: Look for a platform that offers zero fees, so even if you want to scalp some quick profits, you do not lose on the fees. Combined with fractional trading, you can get in on every position for less than $1.
If you're looking for a platform that offers all of these features, Morpher is a great choice. It's specifically designed to provide the best trading experience possible, with maximum flexibility, a wide range of assets to trade, great indicators and an advanced chart view, infinite liquidity, and zero fees. Sign up now and receive your bonus!
Conclusion
Pin bars are an essential tool for traders and should not be overlooked. They are most reliable when predicting sharp price reversals, and longer shadows indicate a more significant price rejection, making them a very accurate signal.
However, pin bars form very often on charts, and it’s crucial to learn how to distinguish false signals by waiting for additional confirmation before entering a trade. Carefully considering the broader market context and other technical indicators can significantly increase your edge. By incorporating pin bars into your trading strategy and using them in conjunction with other analysis techniques, you can improve your overall trading success. Remember to always practice risk management and never rely solely on one signal for making trading decisions. With proper education and experience, pin bars can become a valuable tool in your trading arsenal, helping you to spot potential trading opportunities and make informed decisions in the market.
Disclaimer: All investments involve risk, and the past performance of a security, industry, sector, market, financial product, trading strategy, or individual’s trading does not guarantee future results or returns. Investors are fully responsible for any investment decisions they make. Such decisions should be based solely on an evaluation of their financial circumstances, investment objectives, risk tolerance, and liquidity needs. This post does not constitute investment advice.
Disclaimer: All investments involve risk, and the past performance of a security, industry, sector, market, financial product, trading strategy, or individual’s trading does not guarantee future results or returns. Investors are fully responsible for any investment decisions they make. Such decisions should be based solely on an evaluation of their financial circumstances, investment objectives, risk tolerance, and liquidity needs. This post does not constitute investment advice.

Painless trading for everyone
Hundreds of markets all in one place - Apple, Bitcoin, Gold, Watches, NFTs, Sneakers and so much more.
Painless trading for everyone
Hundreds of markets all in one place - Apple, Bitcoin, Gold, Watches, NFTs, Sneakers and so much more.