
The engulfing candlestick is a widely recognized pattern used by traders to pinpoint potential trend reversals and continuations following a market retracement. The engulfing pattern can be found in all financial markets, including forex, stocks, indices, and cryptocurrencies.
In this article, we’ll explore the bullish and bearish engulfing candlestick patterns and how they can be used to improve the accuracy of your trade entries. We’ll also discuss some trading strategy ideas that can help you improve your trading edge, leading to more informed decisions.
Before we dive into the topic, I want to emphasize that just trading based on engulfing candlestick patterns, without adequate practice and experience, is not a ticket to overnight wealth.
Although candlestick patterns can be lucrative, it requires a certain level of experience to use them effectively. If you’re a beginner, it’s crucial to keep this in mind and approach patterns trading with a realistic mindset.
The most effective way to improve your skills with candlestick patterns is to actively apply your knowledge to live charts and discover the strategies that work with your trading style.
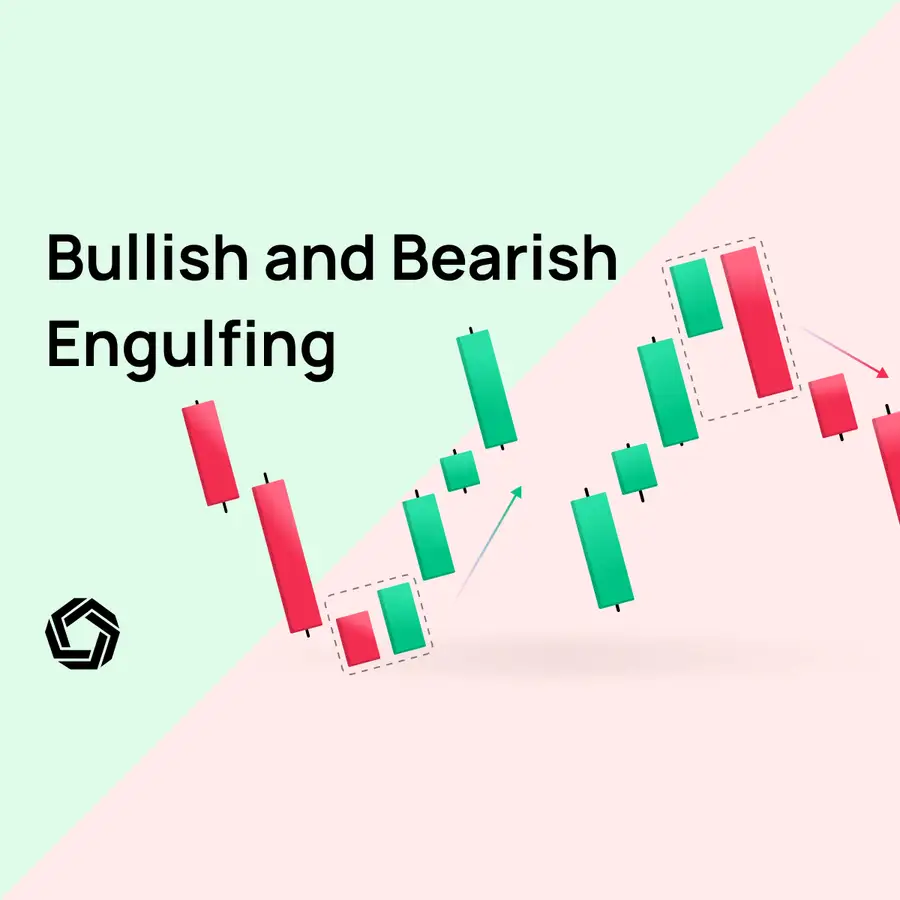
Bullish Engulfing Pattern
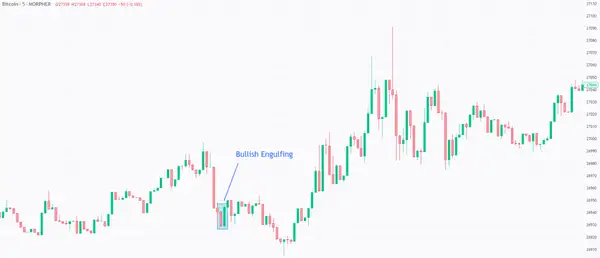
A bullish engulfing pattern is a candlestick pattern that signals a potential reversal of a downtrend or a continuation after a retracement (or pullback). This pattern consists of two candles: the first candle is a relatively small bearish candle, followed by a larger bullish candle that completely engulfs the previous candle. The bullish candle typically opens lower than the previous candle’s close and closes higher than the previous candle’s high. In many cases, the open of the second candle is the same as the close of the previous candle and this can be considered a valid pattern as well.
In general, you will find that engulfing patterns are more accurate on higher timeframes such as daily or weekly and are the most ideal for predicting short-term movements.
What Does a Bullish Engulfing Pattern Look Like?
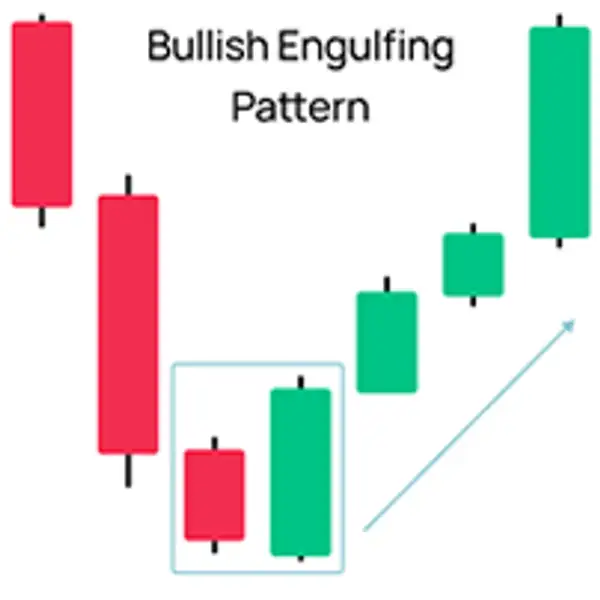
For a bullish engulfing pattern to be valid, the following conditions must be met:
- For reversal signals, the preceding trend should be a downtrend with higher lows and lower lows.
- For trend continuation signals, the preceding trend can be an uptrend or downtrend.
- The first candlestick of the pattern must be bearish (red) and have relatively small shadows.
- The second candlestick should completely engulf the first candlestick and be bullish (green).
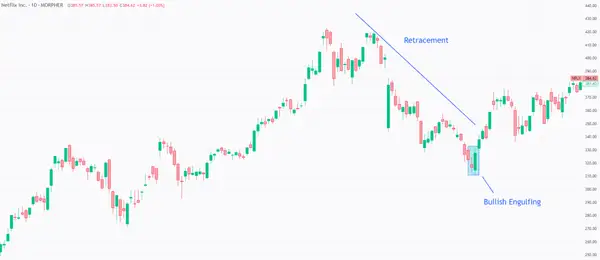
Below is an example of a perfect bullish engulfing pattern formed on the Netflix daily stock chart, indicating a trend continuation after a retracement. The ideal scenario for a engulfing pattern to be accurate is when the second candle has a large body, as this suggests a building momentum.
Bearish Engulfing Pattern
The bearish engulfing pattern is the opposite of a bullish engulfing pattern. It signals a potential reversal of an uptrend or a downtrend continuation after a pullback.
It consists of two candles: the first candlestick is bullish (green) and the second one is a larger bearish (red) candlestick that completely engulfs the previous one.
The bearish candle opens higher than the previous candle’s close and closes lower than the previous candle’s low. But like its bullish counterpart, the bearish engulfing pattern can also have the open of the second candle equal to the close of the previous candle and still be considered a valid pattern.
What Does a Bullish Engulfing Pattern Look Like?
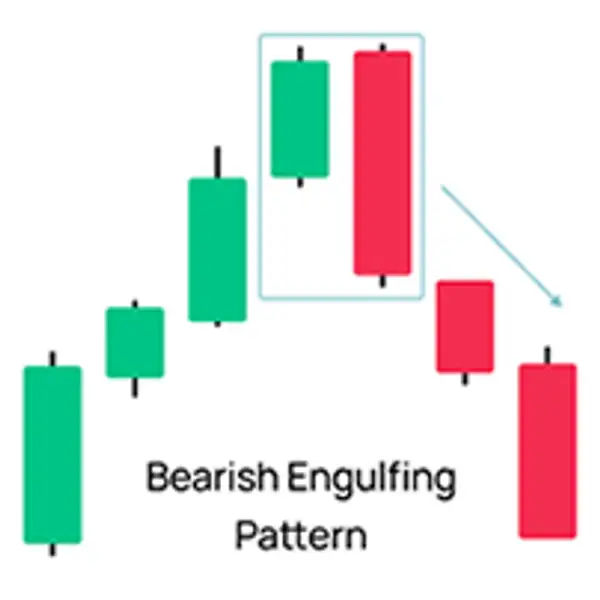
For a bearish engulfing pattern to be valid, the following conditions must be met:
- For reversal signals, the preceding trend should be an uptrend with higher highs and higher lows.
- For trend continuation signals, the preceding trend can also be a downtrend.
- The first candlestick of the pattern must be bullish (green) and have relatively small shadows.
- The second candlestick should completely engulf the first candlestick and be bearish (red).
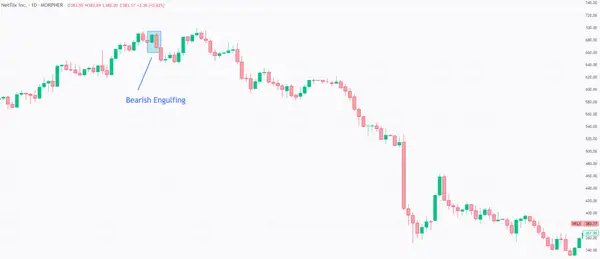
Below is a great example of a bearish engulfing pattern signaling a trend reversal on the Netflix daily chart.
Engulfing Pattern Strategy Ideas
As a trader, it’s important to understand how to act on engulfing signals and determine whether a pattern represents a shift in market sentiment or it’s a false signal.
One approach that aggressive traders usually take is to buy immediately after an engulfing candle formed based on the rules described in the previous sections. However, this strategy requires a higher tolerance for risk because not all engulfing patterns will be successful. So you need to learn how to cut losses short and let profits run longer. This skill can be challenging to master, especially for beginners.
Below is an example of a valid bullish engulfing pattern that formed on the Tesla stock chart. Based on textbook rules, such a pattern should indicate a trend reversal. However, in this specific instance, the price continued its decline for a while before reversing, which would most likely trigger your stop loss.
It’s important to know that not all patterns play out and adding more confirmation signals in your trading strategy can significantly increase your success rate. When analyzing the markets with the candlestick patterns, consider both the pattern itself and the broader market conditions. Here are some key steps to take:
Study the Market Cycles: After identifying a pattern, you should analyze the broader market conditions to determine if they align with the candlestick pattern you're considering for trade. This analysis should include the market’s prevailing trend, its volatility, and any fundamental factors that may be impacting it. If you want to dive deeper into market cycles check our comprehensive guide: Crypto Market Cycles: Staying Ahead of the Game
Look for Confirmation: While candlestick patterns can be strong signals for trend reversal or continuation, traders should always look for confirmation of the pattern before taking a position.
Confirmation can come in the form of a follow-through day, which is a day where the market closes higher than the previous day’s high. Alternatively, you can look for other patterns or use momentum oscillators like Stochastic or RSI to confirm the signal.
Master Risk Management: Finally, you should take into account your risk management plan. This includes setting a stop loss order at an appropriate level to limit potential losses and a take profit level to maximize profits.
Now, let’s explore some strategy examples that demonstrate how combining engulfing patterns with other signals can improve your chances of success.
Strategy 1: Bearish Engulfing and Fibonacci Retracement
It is common for beginner traders to overcomplicate trading. If you’re just starting out, please don’t go down that rabbit hole. Trading doesn’t have to be complicated and still can be profitable. Here is a simple strategy that you can adjust to your trading style to find the edge.
We now know what a bearish engulfing pattern is and what information it provides when it forms in a downtrend, but what about fibonacci retracements.
Bearish Engulfing Pattern (Recap): This is a candlestick pattern that occurs when a small green candle is followed by a larger red candle that completely engulfs the previous candle. This pattern is seen as a bearish reversal signal.
Fibonacci Retracements: A widely-utilized tool in technical analysis, Fibonacci retracements help traders find support and resistance levels. These retracement levels are based on the Fibonacci sequence—a series of numbers where each successive number is the sum of its two predecessors. The most frequently used Fibonacci retracement levels in trading are 38.2%, 50%, and 61.8% also known as the golden ratio.
Now, let’s look at how these two concepts can be combined in a trading strategy.
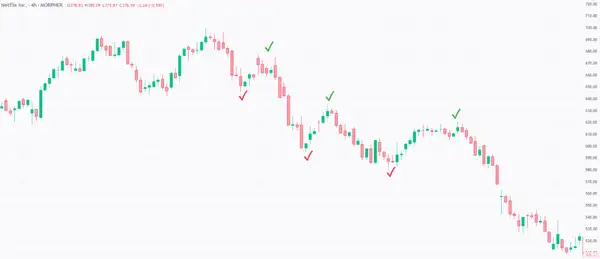
Identify a Downtrend: The first step is to recognize an active downtrend in the market. This can be visualized by a sequence of lower highs and lower lows on the chart. On the Netflix stock chart below the trend is downwards with higher lows (green ✓) and lower lows (red ✓). So our first rule is met. Next, we are looking for a bearish engulfing pattern to form after a fibonacci retracement.
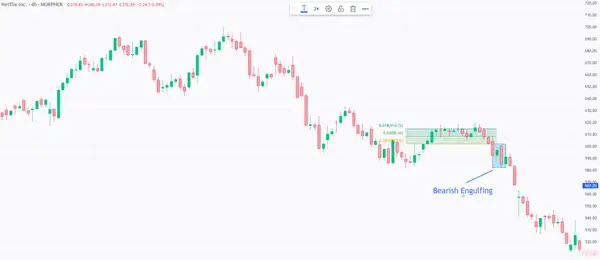
Wait for a Retracement: After identifying the downtrend, wait for the price to pull back or retrace. This counter-move against the prevailing downtrend is your retracement. In our context, the retracement that developed after the A-B swing is what we want to measure. By applying the Fibonacci retracement from point A to B, you'll observe that the price consolidates between the 38.2% and 61.8% levels. These levels often act as resistance zones during a downtrend. With a valid Fibonacci resistance zone in place, our next step is to look for the bearish engulfing pattern.

Spot the Bearish Engulfing Pattern: As the resistance level holds the price, be on the lookout for the bearish engulfing pattern. This pattern should ideally form around one of the significant Fibonacci levels (38.2%, 50%, or 61.8%). The appearance of the bearish engulfing candle at these Fibonacci retracement levels can provide added confirmation of a potential reversal to the downside.
In our example, a perfect bearish engulfing setup formed right below the key Fibonacci resistance levels. With this final rule fulfilled, we are ready to initiate a short sell.
As always, ensure you have risk management measures in place. Setting a stop-loss above the high of the engulfing candle or slightly above the Fibonacci level can help limit potential losses.
Strategy 2: Bullish Engulfing, Trendlines and Relative Strength Index (RSI)
Bullish Engulfing, Trendlines and Relative Strength Index (RSI) is a powerful trading strategy that combines three key technical analysis tools to identify potential reversal points in the market.
The first component of this strategy is the bullish engulfing pattern, which is a candlestick formation that indicates a potential reversal from a downtrend to an uptrend. A bullish engulfing pattern is identified when a candle with a small (red) body is followed by a much larger bullish (green) candle that fully engulfs the preceding candle.
The second component is the use of trendlines to confirm the reversal. A trendline is a straight line that connects two or more price points and represents either support or resistance for the asset’s price. The trendline must be broken to validate the signal.
The third component is the Relative Strength Index (RSI) indicator. The RSI is a momentum indicator that compares the magnitude of recent gains to recent losses, and it ranges from 0 to 100. When RSI is close to 30, it indicates an oversold situation where bears could start losing power in the market and bulls can take over the control anytime.
Now, let’s look at how these three components can be combined in a powerful trading strategy.
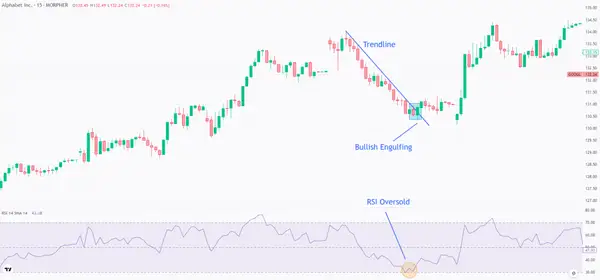
In the chart above you can see a great example of this strategy in action. All trading rules were met on the Alphabet (GOOGLE) chart on 29 September, 2023. By connecting the price points during the market pullback, a clear trendline can be applied. Next, a bullish engulfing pattern appears exactly as the trendline breaks. Ultimately, the RSI indicator marked an ‘oversold' status in this period as well, further confirming the trendline and bullish engulfing signals.
For entry, a close above the trendline could be a good option. For stop loss, refer to this detailed article about best stop loss strategies for trading.
Strategy 3: Bearish Engulfing and Bollinger Bands
Bollinger Bands are a technical analysis tool comprising three bands. The middle band is a simple moving average (SMA) that represents the intermediate-term trend of the stock, while the upper and lower bands are standard deviations of the middle band. In essence, these bands can act as dynamic levels of support and resistance, contracting and expanding based on the stock's volatility.
Now, let's merge the bearish engulfing pattern with the bollinger bands into a cohesive trading strategy.
Bollinger Bands Median Slope: First and foremost, ensure that the median (middle band) of the Bollinger Bands is sloping downwards. This indicates a prevailing bearish trend.
Formation at the Median: Be vigilant and await the emergence of a bearish engulfing pattern right at the median level of the Bollinger Bands. When this pattern surfaces at this precise point, especially against the backdrop of a downward-sloping median, it can be a potent signal of further bearish momentum.
Take Profit: After entering the trade based on the above conditions, aim to book your profits when the price of the stock touches the lower Bollinger Band. Specifically, consider taking profits on the candle's close that makes contact with this lower band.
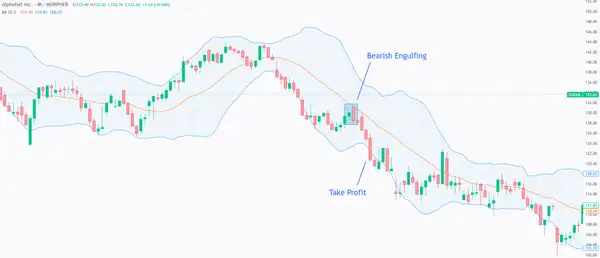
In the Alphabet (GOOGLE) 4-hour chart, all the elements came together. The bearish engulfing candlestick pattern appeared right at the median of the Bollinger Bands, signaling that the stock may be about to change direction and move lower.
Once all these conditions are met, consider short selling the stock looking for a take profit on the close of the candlestick that touches the lower band.
Mistakes to Avoid When Trading Engulfing Patterns
- Entering a trade too early, before the pattern is fully confirmed.
- Failing to set stop-loss orders to minimize potential losses.
- Overtrading, which can increase risk and lower profitability.
- Ignoring broader market conditions like trend and volatility.
- Lacking a clear exit strategy, which can lead to missed opportunities or unnecessary losses.
Best Platform to Trade Candlestick Patterns
When trading candlestick patterns, having the right platform is crucial to success. Here are some key factors to consider when choosing the best platform:
- Maximum Flexibility: Look for a platform that allows you to go long or short on any asset and use leverage to profit from even the smallest signals in any direction.
- Variety of Assets: A good platform should offer a diverse range of assets to trade from, including stocks, cryptocurrencies, commodities, forex, and unique markets. This ensures you can always find useful patterns and profitable markets to trade.
- Great Indicators and Advanced Chart View: The platform should have great indicators and an advanced chart view that allows you to save templates you have created and combine multiple indicators to get the best edge possible.
- Infinite Liquidity: Choosing a platform with infinite liquidity is important, so you can close every position at the exact price you aimed for and have no slippage.
- Zero Fees: Look for a platform that offers zero fees, so even if you want to scalp some quick profits, you do not lose on the fees. Combined with fractional trading, you can get in on every position for less than $1.
If you're looking for a platform that offers all of these features, Morpher is a great choice. It's specifically designed to provide the best trading experience possible, with maximum flexibility, a wide range of assets to trade, great indicators and an advanced chart view, infinite liquidity, and zero fees.
Conclusion
Engulfing patterns are some of the most powerful and reliable indicators in technical analysis, especially when combined with other indicators. These patterns are easy to identify and interpret, making them an essential tool for traders.

Disclaimer: All investments involve risk, and the past performance of a security, industry, sector, market, financial product, trading strategy, or individual’s trading does not guarantee future results or returns. Investors are fully responsible for any investment decisions they make. Such decisions should be based solely on an evaluation of their financial circumstances, investment objectives, risk tolerance, and liquidity needs. This post does not constitute investment advice.

Painless trading for everyone
Hundreds of markets all in one place - Apple, Bitcoin, Gold, Watches, NFTs, Sneakers and so much more.
Painless trading for everyone
Hundreds of markets all in one place - Apple, Bitcoin, Gold, Watches, NFTs, Sneakers and so much more.