
Candlestick psychology is a fascinating tool that can help traders gain valuable insights into market trends and make more informed trading decisions. By understanding the psychology behind candlestick charts and patterns, traders can uncover hidden patterns and potential market movements. In this article, we will delve into the intricacies of candlestick psychology, explore its impact on trading decisions, and provide strategies for applying this knowledge to improve your trading success.
Understanding Candlestick Psychology
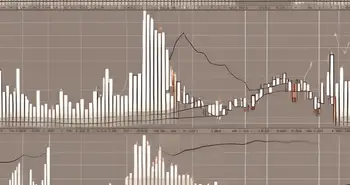
Candlestick charts are a popular tool used by traders to analyze price movements in financial markets. Each candle on the chart represents a specific time period, such as a day or an hour, and provides valuable information about the behavior of market participants. Understanding the basics of candlestick charts is crucial for unlocking their true potential.
The Basics of Candlestick Charts
Candlestick charts consist of two main components: the body and the wick. The body represents the price range between the opening and closing prices, while the wick (also known as the shadow) represents the price range between the highest and lowest prices during the time period.
For example, a green or white candle with a long body indicates that buyers were in control and pushed the price higher. On the other hand, a red or black candle with a long body indicates that sellers dominated and pushed the price lower. By analyzing patterns formed by these candles, traders can gain insight into market sentiment and potential reversals.
The Psychology Behind Candlestick Patterns
Candlestick patterns are formed when multiple candles align in a specific way, indicating a potential change in market sentiment. These patterns can provide valuable clues about the psychology of market participants and can help traders predict future price movements.
For example, the “hammer” pattern is characterized by a small body and a long lower wick, resembling a hammer. This pattern suggests that sellers pushed the price lower but were unable to maintain control, indicating a potential reversal to the upside. By recognizing and interpreting these patterns, traders can gain a valuable edge in their trading decisions.
Delving Deeper into Candlestick Patterns
While understanding the basics of candlestick charts and patterns is important, delving deeper into the world of candlestick patterns opens up even more possibilities for traders.
Common Candlestick Patterns and Their Meanings
There are numerous candlestick patterns that traders can use to analyze market behavior and identify potential trading opportunities. From the popular “doji” pattern, which suggests market indecision, to the powerful “engulfing” pattern, which indicates a potential trend reversal, each pattern carries its own unique meaning.
For example, the “evening star” pattern is characterized by a large green or white candle, followed by a smaller candle with a small body and long upper wick, and finally, a large red or black candle. This pattern signifies a potential reversal from an uptrend to a downtrend, indicating a shift in market sentiment from bullish to bearish.
The Role of Emotion in Candlestick Patterns
One of the fascinating aspects of candlestick psychology is the role of human emotion in the formation of patterns. Market participants' emotions, such as fear and greed, can lead to patterns that provide valuable insights into potential market movements.
For instance, the “morning star” pattern is formed when a large red or black candle is followed by a smaller candle with a small body and long lower wick, and finally, a large green or white candle. This pattern signals a potential reversal from a downtrend to an uptrend, highlighting a shift in market sentiment from bearish to bullish.
The Impact of Candlestick Psychology on Trading Decisions
Candlestick psychology plays a crucial role in shaping trading decisions and maximizing trading success. By understanding how market participants' emotions influence candlestick patterns, traders can make more informed decisions and adapt their strategies accordingly.
How Candlestick Psychology Influences Buying and Selling
Buyers and sellers in financial markets are driven by a multitude of factors, including greed, fear, and market sentiment. These emotions can be clearly seen in candlestick patterns, providing valuable insights into potential buying and selling opportunities.
For example, if a trader identifies a bullish candlestick pattern, indicating a potential uptrend, they may decide to enter a long position, anticipating further price appreciation. Conversely, if a bearish candlestick pattern suggests a potential downtrend, the trader may choose to enter a short position, hoping to profit from a price decline.
The Role of Candlestick Psychology in Risk Management
Candlestick psychology also plays a vital role in effective risk management. By analyzing candlestick patterns, traders can identify potential support and resistance levels, helping them set more accurate stop-loss and take-profit levels.
For instance, if a trader spots a strong resistance level indicated by a bearish candlestick pattern, they may choose to place a stop-loss order slightly above that level to limit potential losses. Similarly, if a bullish candlestick pattern suggests a potential support level, the trader may consider setting a take-profit order near that level to lock in profits.
Strategies for Applying Candlestick Psychology
Now that we have explored the intricacies of candlestick psychology and its impact on trading decisions, let's discuss some effective strategies for applying this knowledge in your trading.
Tips for Interpreting Candlestick Patterns
When interpreting candlestick patterns, it is essential to consider the context in which they appear. Factors such as the overall market trend, volume, and the presence of other technical indicators should be taken into account to confirm the validity of the pattern.
For example, if a bullish candlestick pattern appears during a strong uptrend and is accompanied by high trading volume, it carries a higher probability of a successful reversal. Conversely, if a bearish pattern appears during a downtrend with low volume, it may indicate a weaker reversal signal.
Incorporating Candlestick Psychology into Your Trading Plan
To fully harness the power of candlestick psychology, it is crucial to incorporate it into your overall trading plan. This can be accomplished by combining candlestick patterns with other technical indicators and fundamental analysis.
For example, if a bullish candlestick pattern suggests a potential trend reversal, you can further strengthen your conviction by analyzing other indicators like moving averages or support and resistance levels. By combining multiple tools, you can increase the probability of making successful trading decisions.
The Future of Candlestick Psychology
The field of candlestick psychology is constantly evolving, driven by advances in technology and market dynamics. Traders must stay informed about the latest developments to adapt and thrive in the ever-changing trading landscape.
Technological Advances and Candlestick Psychology
The advent of advanced trading platforms and charting software has revolutionized the way traders analyze and interpret candlestick patterns. These technological advances provide traders with more powerful tools and real-time data, enabling them to make more accurate trading decisions.
For example, traders can now access automated candlestick pattern recognition tools that scan multiple markets and timeframes, highlighting potential trading opportunities. These tools can save time and effort while increasing the chances of spotting profitable setups.
The Ongoing Evolution of Candlestick Psychology in Trading
As market dynamics continue to evolve, so does the field of candlestick psychology. Traders need to stay adaptive and continuously update their knowledge to stay ahead of the curve.
Personally, I have witnessed the power of candlestick psychology in my own trading journey. It has helped me identify high-probability trading setups, manage risk effectively, and make informed decisions in volatile market conditions. Embracing candlestick psychology has transformed my trading approach and significantly improved my trading results.
FAQs
What are candlestick charts?
Candlestick charts are graphical representations of price movements in financial markets. Each candle on the chart represents a specific time period and provides valuable information about the behavior of market participants.
How can candlestick patterns help traders?
Candlestick patterns help traders analyze market behavior and predict potential price movements. By understanding the psychology behind these patterns, traders can gain valuable insights into market sentiment and make more informed trading decisions.
What role does emotion play in candlestick psychology?
Human emotions, such as fear and greed, play a significant role in the formation of candlestick patterns. By recognizing and interpreting these patterns, traders can gain insights into the emotions driving market participants and use this knowledge to their advantage.
How can I incorporate candlestick psychology into my trading plan?
To incorporate candlestick psychology into your trading plan, you can start by learning and understanding different candlestick patterns. You can then combine this knowledge with other technical indicators and fundamental analysis to increase the accuracy of your trading decisions.
What is the future of candlestick psychology?
The future of candlestick psychology lies in technological advancements and the ongoing evolution of market dynamics. Traders should stay informed about the latest developments to adapt their strategies and remain successful in the ever-changing trading landscape.
In conclusion, understanding candlestick psychology is crucial for traders looking to unlock the hidden insights within price charts. By mastering the art of interpreting candlestick patterns, traders can gain a powerful edge in their trading decisions. So take the time to dive deep into the intricacies of candlestick psychology, and watch your trading success soar.
Ready to apply the insights of candlestick psychology to your trading strategy? Discover the transformative power of Morpher, the blockchain-based trading platform that offers zero fees, infinite liquidity, and a unique trading experience across a multitude of markets. Whether you're interested in stocks, cryptocurrencies, or even niche markets like NFTs, Morpher provides the tools for fractional investing, short selling, and up to 10x leverage to enhance your trading potential. Sign up now at Morpher.com and receive your free sign-up bonus to start trading with an innovative platform that puts you in control. Embrace the future of trading with Morpher and watch your trading success soar.

Disclaimer: All investments involve risk, and the past performance of a security, industry, sector, market, financial product, trading strategy, or individual’s trading does not guarantee future results or returns. Investors are fully responsible for any investment decisions they make. Such decisions should be based solely on an evaluation of their financial circumstances, investment objectives, risk tolerance, and liquidity needs. This post does not constitute investment advice.

Painless trading for everyone
Hundreds of markets all in one place - Apple, Bitcoin, Gold, Watches, NFTs, Sneakers and so much more.
Painless trading for everyone
Hundreds of markets all in one place - Apple, Bitcoin, Gold, Watches, NFTs, Sneakers and so much more.