If you're looking to elevate your trading game and achieve success in the financial markets, understanding the concept of divergence is an essential skill to master. Divergence refers to a powerful trading signal that can provide valuable insights into market trends and potential reversals. In this comprehensive guide, I will walk you through the basics of divergence, its different types, and how to identify and trade it effectively.
Understanding the Concept of Divergence
The Basics of Divergence
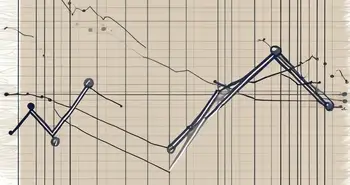
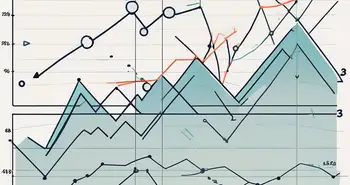
Divergence occurs when the price of an asset and an indicator, such as the Relative Strength Index (RSI) or Moving Average Convergence Divergence (MACD), move in opposite directions. It often signifies a potential reversal in the ongoing trend, giving traders an opportunity to profit from the market's changing dynamics.
For example, if the price of a stock is making higher highs, but the RSI is making lower highs, this is known as bearish divergence. It suggests that the stock's upward momentum is weakening, and a potential reversal to the downside may occur.
The Importance of Divergence in Trading
Divergence acts as a powerful tool for traders, providing valuable insights that help to confirm or question the validity of a market trend. By understanding and effectively utilizing divergence analysis, traders can enhance their decision-making process and increase their chances of success.
Identifying divergence allows traders to anticipate potential market reversals, enabling them to enter trades with favorable risk-reward ratios. It helps traders to avoid chasing trends and instead identify early signs of a trend reversal, positioning themselves ahead of the curve.
Types of Divergence
Regular Divergence
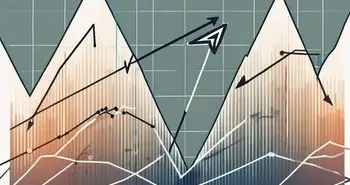
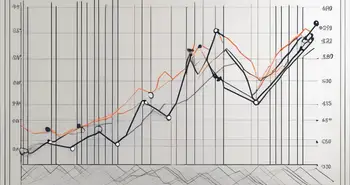
Regular divergence is the most commonly used type of divergence. It occurs when the price of an asset forms a higher high or lower low, while the corresponding indicator fails to make a matching high or low. Regular divergence can indicate an impending trend reversal, and traders often use it as a signal to enter or exit trades.
Hidden Divergence
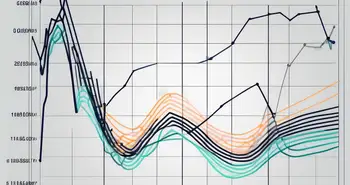
Hidden divergence is another powerful form of divergence, but it is less commonly discussed. It occurs when the price of an asset makes a higher high or lower low, while the corresponding indicator forms a lower high or higher low. Hidden divergence typically signals that the trend is likely to continue, and traders can use it as an opportunity to enter trades in the direction of the prevailing trend.
Identifying Divergence on Trading Charts
Spotting Regular Divergence
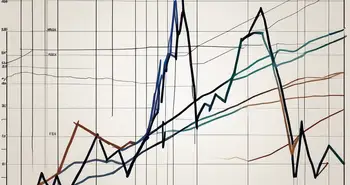
When identifying regular divergence, it's crucial to compare the price action and the corresponding indicator. Look for situations where the price forms either higher highs or lower lows while the indicator fails to follow suit. Regular divergence can be spotted on various timeframes, from intraday charts to longer-term charts.
An effective way to confirm regular divergence is to use multiple indicators simultaneously. Combining different indicators, such as the RSI, MACD, and Stochastic Oscillator, can help to strengthen the divergence signal and provide a higher degree of confidence in your trading decisions.
Recognizing Hidden Divergence
To identify hidden divergence, you need to observe the price action and the corresponding indicator. Look for instances where the price forms higher highs or lower lows while the indicator fails to confirm these movements by forming lower highs or higher lows. Hidden divergence can be particularly useful for trend-following traders, as it highlights the continuation of the existing trend.
Similar to regular divergence, using multiple indicators can help to increase the reliability of hidden divergence signals. By combining different indicators and confirming the hidden divergence across different timeframes, you can enhance the accuracy of your trades and optimize your risk-reward ratio.
Strategies for Trading Divergence
Entry and Exit Points
When trading divergence, it's crucial to have a well-defined entry and exit strategy. One popular approach is to wait for the divergence signal to be confirmed by a candlestick pattern or a trendline breakout. This confirmation provides traders with additional confidence in the potential reversal.
Additionally, combining divergence with other technical analysis tools, such as support and resistance levels or Fibonacci retracement levels, can further enhance your trading decisions. These additional tools can help you identify optimal entry and exit points and manage your risk effectively.
Risk Management in Divergence Trading
As with any trading strategy, risk management is essential when trading divergence. It's advisable to set stop-loss orders to limit potential losses if the market moves against your position. Traders should also consider employing proper position sizing techniques to ensure their trades are aligned with their risk tolerance and account size.
Furthermore, diversifying your portfolio and not relying solely on divergence signals can help to mitigate risk. By having a well-balanced trading approach and incorporating other strategies and techniques, you can secure a more robust trading plan.
Throughout my years of trading, I've seen firsthand the power of divergence in capturing profitable trades and avoiding market pitfalls. One of the most valuable pieces of advice I can offer is to always combine divergence analysis with other technical analysis tools and confirmatory signals. This comprehensive approach will certainly enhance your trading accuracy and increase your chances of success.
Common Mistakes in Divergence Trading
Misinterpreting Divergence Signals
One common mistake traders make when using divergence signals is misinterpreting them. Divergence should not be viewed as a standalone indicator but rather as a tool to complement other forms of analysis. It is crucial to consider the overall market context, trend, and other technical factors to validate the divergence signal.
Overtrading due to Divergence
Another common pitfall is overtrading based on divergence signals alone. While divergence can be a powerful tool, it should not be the sole reason for entering or exiting trades. Traders should exercise patience and wait for confirmation from other technical factors before executing a trade.
Frequently Asked Questions (FAQ)
What is divergence, and why is it important in trading?
Divergence refers to a trading signal that occurs when the price of an asset and an indicator move in opposite directions. It is important in trading as it provides valuable insights into potential trend reversals, helping traders make informed decisions and increase their chances of success.
What are the different types of divergence?
The two main types of divergence are regular divergence and hidden divergence. Regular divergence occurs when the price makes higher highs or lower lows, while the indicator fails to follow suit. Hidden divergence, on the other hand, occurs when the price makes higher highs or lower lows, while the indicator forms lower highs or higher lows.
How can I identify divergence on trading charts?
To identify divergence, observe the price action and the corresponding indicator. Look for situations where the price forms higher highs or lower lows while the indicator fails to confirm these movements. Using multiple indicators and confirming the divergence across different timeframes can increase the reliability of divergence signals.
What are some strategies for trading divergence?
When trading divergence, it's important to have a well-defined entry and exit strategy. Wait for the divergence signal to be confirmed by additional technical factors, such as candlestick patterns or trendline breakouts. Implement proper risk management techniques, set stop-loss orders, and consider diversifying your trading portfolio.
What are some common mistakes to avoid in divergence trading?
One common mistake is misinterpreting divergence signals. Divergence should be combined with other forms of analysis to validate its significance. Another mistake is overtrading based solely on divergence signals. Exercise patience and wait for confirmatory signals before executing trades.
By understanding and effectively utilizing divergence in your trading, you can gain a valuable edge in the financial markets. Remember to remain disciplined, continuously learn and adapt your strategies, and never stop refining your trading skills. May the power of divergence guide you towards trading success!
Ready to put your newfound knowledge of divergence trading into action? Look no further than Morpher, the revolutionary trading platform that empowers you with zero fees, infinite liquidity, and the flexibility of fractional investing. Whether you're looking to trade stocks, cryptocurrencies, or even niche markets like NFTs, Morpher's blockchain-based platform offers a unique trading experience with up to 10x leverage and the safety of a non-custodial wallet. Sign Up and Get Your Free Sign Up Bonus today to start trading on a platform that's as innovative as your strategies. Embrace the future of investing with Morpher!

Disclaimer: All investments involve risk, and the past performance of a security, industry, sector, market, financial product, trading strategy, or individual’s trading does not guarantee future results or returns. Investors are fully responsible for any investment decisions they make. Such decisions should be based solely on an evaluation of their financial circumstances, investment objectives, risk tolerance, and liquidity needs. This post does not constitute investment advice.

Painless trading for everyone
Hundreds of markets all in one place - Apple, Bitcoin, Gold, Watches, NFTs, Sneakers and so much more.
Painless trading for everyone
Hundreds of markets all in one place - Apple, Bitcoin, Gold, Watches, NFTs, Sneakers and so much more.