
If you're looking to take your trading skills to the next level, then understanding and harnessing the power of Kagi chart trading is a must. Kagi charts provide valuable insights into market trends and can help you identify key entry and exit points with precision. In this article, we'll explore the basics of Kagi charts, discuss their significance in trading, delve into effective strategies for using them, and address common mistakes that traders make and how to avoid them. Let's dive in!
Understanding the Basics of Kagi Charts
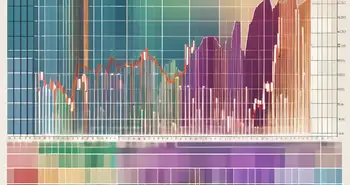
Kagi charts have been around for over a century and were developed in Japan. They offer a unique perspective on price action by focusing solely on changes in direction rather than time or volume. This makes them particularly useful for detecting trends, as they filter out the noise often present in traditional candlestick charts.
Kagi charts are known for their simplicity and effectiveness in capturing market sentiment. Traders appreciate the clear visual representation of price movements that Kagi charts provide, making it easier to identify trend changes and potential entry or exit points in the market.
The History and Origin of Kagi Charts
Kagi charts originated in Japan during the late 19th century and were initially used to track fluctuations in rice prices. The word “Kagi” itself translates to “key” in Japanese, which is fitting as Kagi charts unlock key insights into market trends and reversals.
Over time, Kagi charts have evolved to be applied to various financial markets beyond commodities like rice. Their adaptability and effectiveness in trend analysis have made them a valuable tool for traders across different asset classes, including stocks, forex, and cryptocurrencies.
Key Elements of a Kagi Chart
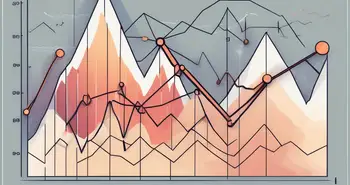
When analyzing a Kagi chart, it's important to understand its key elements. The most crucial components are the Kagi lines, which change direction only when a predefined price movement occurs. This predefined movement, known as the reversal amount, can be adjusted to suit your specific trading style and timeframe.
In addition to the Kagi lines, some charts may also include other elements such as price gaps and shoulders, which can provide further insights into market dynamics. These nuances in Kagi chart patterns can help traders anticipate potential trend reversals and make more informed trading decisions.
How to Read a Kagi Chart
Reading a Kagi chart is relatively straightforward. Each line on the chart represents a predefined price movement, and a new line is drawn when the price exceeds that movement threshold. The thickness of the lines can also provide additional information, with thicker lines indicating a strong trend and thinner lines indicating a weaker trend or consolidation.
Traders often use Kagi charts in conjunction with other technical analysis tools to confirm signals and improve the overall accuracy of their trading strategies. By combining Kagi charts with indicators like moving averages or oscillators, traders can enhance their understanding of market trends and potential entry or exit points.
The Significance of Kagi Charts in Trading
Kagi charts offer several advantages over traditional candlestick charts, making them a valuable tool for traders.
Kagi Charts vs. Traditional Candlestick Charts
Unlike candlestick charts, which display every price movement regardless of its significance, Kagi charts filter out noise and focus on meaningful price reversals. This makes it easier to identify trends and reversals, eliminating the confusion caused by excessive market noise.
The Role of Kagi Charts in Identifying Market Trends
Kagi charts excel at identifying and visualizing market trends. By focusing on price reversals instead of time or volume, they provide a clear picture of the overall market direction. Whether you're a swing trader or a long-term investor, Kagi charts can help you stay on the right side of the trend and make informed trading decisions.
Benefits of Using Kagi Charts in Trading
Using Kagi charts in your trading can provide numerous benefits. They help in filtering out market noise, identifying trends, and spotting key support and resistance levels. Additionally, Kagi charts are versatile and can be used for various financial markets, including stocks, commodities, and forex.
Strategies for Kagi Chart Trading
Now that we've covered the basics of Kagi charts and their significance, let's explore some effective strategies for utilizing them in your trading.
Timing Trades with Kagi Charts
Kagi charts can help you time your trades more effectively by providing clear signals for entry and exit points. As a trend-following tool, they excel at identifying trend reversals, helping you enter positions early and exit before the trend exhausts itself.
Identifying Buy and Sell Signals with Kagi Charts
Kagi charts offer valuable buy and sell signals using their shift in direction. When the Kagi line shifts from rising to falling, it indicates a potential sell signal, while a shift from falling to rising indicates a potential buy signal. These signals can be further confirmed by combining Kagi charts with other technical indicators.
Combining Kagi Charts with Other Trading Tools
To maximize the effectiveness of your Kagi chart analysis, consider combining them with other trading tools such as moving averages, trendlines, or oscillators. This multidimensional approach can help you confirm trends and strengthen your trading decisions.
Common Mistakes in Kagi Chart Trading and How to Avoid Them
While Kagi charts are a powerful tool, there are common mistakes that traders often make when using them. Let's explore these pitfalls and how to avoid them.
Misinterpreting Kagi Chart Signals
One common mistake is misinterpreting Kagi chart signals. It's important to remember that Kagi charts are primarily trend-following tools and may not provide accurate signals in choppy or sideways markets. Always consider the overall market context and use additional technical analysis tools to confirm your signals.
Overreliance on Kagi Charts
Another mistake is overrelying solely on Kagi charts for trading decisions. While they are powerful, it's crucial to incorporate other forms of analysis, such as fundamental analysis or sentiment analysis, to get a complete picture of the market.
Ignoring Market Context in Kagi Chart Trading
Lastly, many traders make the mistake of solely focusing on the Kagi chart and ignoring the broader market context. It's essential to consider factors such as economic news, company earnings, or geopolitical events that could impact the market. By combining Kagi charts with a holistic approach, you'll be better equipped to make informed trading decisions.
FAQ
Q: What is the main advantage of using Kagi charts over traditional candlestick charts?
A: Unlike candlestick charts, Kagi charts filter out noise and focus on meaningful price reversals, making it easier to identify trends and reversals and eliminating confusion caused by excessive market noise.
Q: Can Kagi charts be used for different financial markets?
A: Yes, Kagi charts are versatile and can be used for various financial markets, including stocks, commodities, and forex. They provide valuable insights into market trends regardless of the asset class.
Q: How can I time my trades better using Kagi charts?
A: Kagi charts can help you time your trades more effectively by providing clear signals for entry and exit points. They excel at identifying trend reversals, helping you enter positions early and exit before the trend exhausts itself. Combine Kagi charts with other technical indicators for confirmation.
Q: What is the most common mistake traders make when using Kagi charts?
A: One common mistake is misinterpreting Kagi chart signals. Remember that Kagi charts are primarily trend-following tools and may not provide accurate signals in choppy or sideways markets. Always consider the overall market context and use additional technical analysis tools to confirm your signals.
Q: Are Kagi charts suitable for short-term or long-term trading?
A: Kagi charts can be used for both short-term and long-term trading strategies. Their ability to identify trends and reversals makes them valuable for swing traders and long-term investors alike.
Unlocking the power of Kagi chart trading opens up a world of opportunities for traders. By understanding the basics, appreciating their significance, implementing effective strategies, and avoiding common mistakes, you'll enhance your trading skills and increase your chances of success in the markets. So, start exploring the fascinating world of Kagi charts and take your trading to new heights!
Ready to elevate your trading with the innovative power of Kagi charts? Embrace the future of investing with Morpher, the revolutionary trading platform that leverages blockchain technology for a seamless, zero-fee experience. Whether you're interested in stocks, cryptocurrencies, or even niche markets like NFTs, Morpher's infinite liquidity and fractional investing options have got you covered. Sign up today, take advantage of up to 10x leverage, and enjoy the safety of the Morpher Wallet. Don't miss out on your chance to transform your trading strategy. Sign Up and Get Your Free Sign Up Bonus now, and unlock the full potential of your investments!

Disclaimer: All investments involve risk, and the past performance of a security, industry, sector, market, financial product, trading strategy, or individual’s trading does not guarantee future results or returns. Investors are fully responsible for any investment decisions they make. Such decisions should be based solely on an evaluation of their financial circumstances, investment objectives, risk tolerance, and liquidity needs. This post does not constitute investment advice.

Painless trading for everyone
Hundreds of markets all in one place - Apple, Bitcoin, Gold, Watches, NFTs, Sneakers and so much more.
Painless trading for everyone
Hundreds of markets all in one place - Apple, Bitcoin, Gold, Watches, NFTs, Sneakers and so much more.