
There are many different approaches that traders can use to try and predict future price movements. One such approach is mean reversion theory, which suggests that asset prices tend to move towards their average over time. In this article, we will explain what mean reversion theory is and provide you with three different strategies that you can try out. By the end of this article, you should have a solid understanding of mean reversion and some practical tools that you can use to put this theory into practice.
What Is Mean Reversion Trading?
Mean reversion is a trading strategy that aims to capitalize on the tendency of asset prices to revert to their historical averages. In essence, mean reversion traders buy assets when they are cheap and sell them when they are expensive, assuming that prices will eventually revert to their mean levels. In this article, we will explain the basic concepts of mean reversion, its application in finance, and its key assumptions and limitations.
Basic Concepts of Mean Reversion
Mean reversion is based on the statistical concept of regression toward the mean, which refers to how points are spread around a linear regression line. In other words, it describes how well-predicted values based on an equation for the line match the actual values from which the line was derived.
To illustrate this concept, consider the example of Sir Francis Galton, who studied the genetic influences on height by comparing fathers and sons. Galton expected that fathers' height would predict their sons' height. However, he found that taller fathers had shorter sons and shorter fathers had taller sons. Galton made a logical error by assuming that height would “regress toward mediocrity” over generations, without accounting for the fact that mothers' genetics play an equally important role in determining the height of their children. Galton's error led to the term “regression toward the mean,” which is a misnomer in this context.
In trading, mean reversion refers to the idea that when an asset's price is extremely high or low, it will revert to its mean level. However, this is not a consistent process from one time point to the next. Mean reversion is also viewed as a “failure to meet expectations” in statistical theory, as a regression line is used to make predictions that may fail to meet expectations due to imperfect correlations between predictor and criterion variables.
Mean Reversion in Finance
Mean reversion is a popular trading strategy in finance that aims to profit from the tendency of asset prices to revert to their historical averages. This strategy is based on the assumption that the “true” value of an asset is the same at different time points, and that the current posted price is not an accurate reflection of this value due to random factors.
For example, a stock price may rise artificially due to poor information, which is a random effect. During a given time point, the masses may become “elated,” leading to a random change in mood that may dissipate over time, causing the “true” value of the stock to shine through and “revert back to normal.”
However, mean reversion is not always relevant in finance. Stock prices may be based on the fundamentals of a company, which may or may not change, and on popular opinion, which may change and remain stable over the long term. To the extent that either of these factors accounts for the change in price between two time points, mean reversion may not occur.
Key Assumptions and Limitations
Three assumptions are made when using the concept of regression toward the mean to understand stock prices:
(1) the “true” value of the stock is exactly the same at different time points
(2) the current posted price is not an accurate reflection of the “true” value of the stock
(3) the discrepancy between the posted price at different time points is entirely due to random factors
While the first two assumptions are often met in finance, the third assumption may not always hold true. The prices of stocks are somewhat based on the fundamentals of the company, which may or may not change, and on popular opinion, which may change and remain stable over the long term.
Mean Reversion Strategy Ideas
1. MACD Indicator
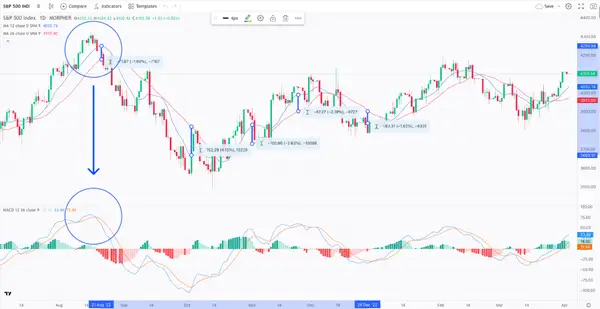
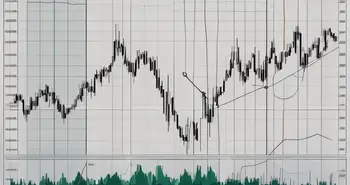
One trading strategy involves using the fast and slow moving average and the MACD indicator. In this strategy, the fast moving average is set to 12 days, while the slow moving average is set to 26 days. The Moving Average Convergence Divergence (MACD) is utilized to identify shifts in momentum in stock prices. The MACD consists of two lines: the MACD line (blue) and the signal line (orange).
To calculate the MACD line, the 26-period exponential moving average (EMA) is subtracted from the 12-period EMA. The signal line is a 9-period EMA of the MACD line. A bullish signal is generated when the MACD line crosses above the signal line, indicating that the stock price is likely to rise. Conversely, a bearish signal is generated when the MACD line crosses below the signal line, indicating that the stock price is likely to fall.
When the fast moving average increases at a quicker pace than the slow moving average, the difference between the two increases, and a potential short opportunity arises according to the mean reversion strategy. The belief is that the short-term trend will adjust to the long-term trend. The information candles are used to show the largest differences in the moving averages. For example, the largest price decrease was around 100, while the largest price increase was around 150. Once the difference starts approaching these levels, a price reversal may be imminent.
In summary, the mean reversion strategy with the MACD assumes that the short-term trend will always revert back to the mean. If the MACD is getting too high or too low, a position may be taken. The position is exited once the short-term trend crosses to the other side of the long-term trend.
Trading Rules:
- Increase in fast and slow moving averages difference
- High or low MACD value
- MACD falls below MACD Signal, when MACD is higher than a certain level
- MACD rises above MACD Signal, when MACD is lower than a certain level
- Short or long position.
2. Bollinger Bands Indicator and Commodity Channel Index (CCI)

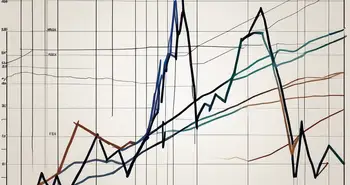
The second trading strategy involves using Bollinger Bands and the Commodity Channel Index (CCI). This strategy is particularly useful for intraday trading because it can provide useful momentum indicators for mean reversion strategies.
Bollinger Bands is a technical analysis tool that consists of a moving average (usually 20 periods) and two standard deviation lines above and below it. These bands can help traders identify potential price reversals by indicating when the price is overbought or oversold. If the price moves outside of the bands, it is considered an extreme move, and traders may look for a mean reversion back toward the moving average.
The Commodity Channel Index (CCI) is another technical analysis tool that measures the difference between the current price and its average price over a given period. Values above 100 indicate a strong upward trend, while values below -100 indicate a strong downward trend. Values between -100 and 100 indicate a ranging market. The CCI can help traders identify potential trend reversals.
To use this strategy, traders can combine Bollinger Bands and CCI to identify potential price reversals. If the price moves outside of the Bollinger Bands, and the CCI indicates an overbought or oversold condition, traders may look for a mean reversion back toward the moving average. Conversely, if the price is trading within the Bollinger Bands, and the CCI indicates a trending market, traders may look for a continuation of the trend.
To execute this strategy, traders should look for candles closing above or below the Bollinger Bands and confirm that the CCI is above 100 or below -100 before entering a long or short position. Traders should exit the position when the price reverts back to the middle of the Bollinger Bands.
Trading Rules
- Look for candles outside the Bollinger bands
- Confirm that the CCI is above 100 or below -100
- Enter Short or Long position
- Exit when price crosses the middle Bollinger band
3. RSI Indicator
The RSI indicator can be used for mean reversion trading by identifying overbought and oversold conditions. The RSI compares the average gains and losses of an asset over a specified time frame and provides a reading between 0 and 100. A reading above 70 indicates overbought conditions, while a reading below 30 indicates oversold conditions.
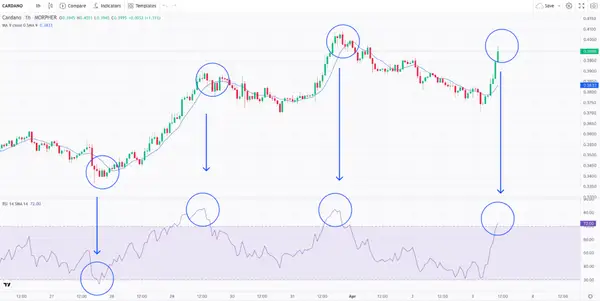
To use the RSI for mean reversion trading, look for signals that indicate overbought or oversold conditions, then enter a position in the opposite direction, assuming that the price will eventually revert back to its mean value. When trading the Cardano chart, we use this strategy by entering a position when the RSI is above 70 or below 30. We exit the position once the price reverts back to the moving average and the RSI is around 50, indicating a neutral market position.
In the Cardano chart example, we can see three successful entry positions when the RSI is either above 70 or below 30. Additionally, when the RSI crosses the 70 mark in real-time, we can potentially enter a short position, provided that we also identify a reliable candlestick pattern to confirm the trade.
Trading Rules
- Look for RSI values below 30 or above 70 to identify oversold or overbought conditions, respectively.
- Once you have confirmed the reversal signal, enter a position in the opposite direction of the current trend.
- Once the price reaches a point around the mean value or shows signs of a trend reversal, look for an RSI value around 50 and exit the position to take profits.
Note: This mean reversion strategy can be used in combination with other technical indicators or fundamental analysis, to improve its accuracy and increase the probability of profitable trades.
Limitations of the Mean Reversion Trading
Mean reversion trading also has its limitations, as no trading strategy is foolproof. While it can be effective in certain market conditions, it may not work well in others. The success of mean reversion trading also depends on various factors, such as the specific rules set for entry and exit, the asset being traded, and market volatility. As with any trading strategy, it is important to exercise caution and not rely solely on mean reversion trading for all trading decisions. Backtesting and research are essential to determine the effectiveness of the strategy in different market conditions, and diversification is key to managing risk exposure.
Conclusion
In conclusion, mean reversion strategies can be a valuable tool in your arsenal. They rely on the premise that overextended price movements tend to revert back to their mean value, allowing traders to profit from the market's natural tendency to self-correct.
While the concept of mean reversion is not new, there are still many ways to implement it, from simple moving averages to more complex indicators like Bollinger Bands, CCI, and RSI. It is important to remember that no strategy is foolproof and that past performance does not guarantee future success. Therefore, thorough backtesting and careful risk management are crucial to any successful trading strategy. With these considerations in mind, mean reversion strategies can be a valuable addition to your toolkit.

Disclaimer: All investments involve risk, and the past performance of a security, industry, sector, market, financial product, trading strategy, or individual’s trading does not guarantee future results or returns. Investors are fully responsible for any investment decisions they make. Such decisions should be based solely on an evaluation of their financial circumstances, investment objectives, risk tolerance, and liquidity needs. This post does not constitute investment advice.

Painless trading for everyone
Hundreds of markets all in one place - Apple, Bitcoin, Gold, Watches, NFTs, Sneakers and so much more.
Painless trading for everyone
Hundreds of markets all in one place - Apple, Bitcoin, Gold, Watches, NFTs, Sneakers and so much more.