Price action trading relies on the analysis of historical price data to identify trading opportunities. The basic premise of price action trading is that all the information that is needed to make a trading decision is contained in the price chart.
This article provides a comprehensive guide to price action trading, covering everything from the basics of price action analysis to advanced trading strategies.
Historical Context and Evolution of Price Action Trading
The historical context of price action trading can be traced back to the early days of financial markets. In the 17th century, Japanese rice traders began to use a form of price action analysis called candlestick charting. Candlestick charts are still used by price action traders today.
In the 19th century, Western traders began to develop their own forms of price action analysis. One of the most influential traders of this era was Charles Henry Dow. Dow, a co-founder of The Wall Street Journal and the Dow Jones & Company, developed the theory of moving averages, which is still used by price action traders today.
One of the most important developments in the 20th century was the introduction of electronic trading. Electronic trading made it possible for traders to trade 24 hours a day, 7 days a week. This led to an increase in the volume of trading and the development of new trading strategies.
What is Price Action
Price action is a technical analysis approach that uses historical price data to predict future price movements. Its basic premise is that all the information that is needed to make a trading decision is contained in the price chart. It is therefore quite different than using a fundamental analysis approach which seeks to understand an asset’s intrinsic value.
Price action traders believe that an asset’s price is determined by supply and demand. When demand for an asset exceeds the asset’s supply, its price will turn bullish. When the supply of an asset exceeds the asset’s demand, its price will turn bearish.
Key Price Action Trading Principles and Concepts
Price action traders look for trends in the market: sustained price movement of a security in one direction. Traders can use trends to identify potential trading opportunities.
Support and resistance are levels where buyers and sellers are likely to come into balance. Support is a level where buyers are likely to step in and prevent the price from falling further. Resistance is a level where sellers are likely to step in and prevent the price from rising further.
Candlestick patterns are a type of price pattern that can be used to identify potential trading opportunities. There are hundreds of candlestick patterns, but some of the most common include the bullish engulfing pattern, the bearish engulfing pattern, and the hammer pattern.
Volume is the number of shares or contracts that are traded in a given period of time. Volume can be used to measure the strength of a trend or to identify areas of support and resistance.
Volatility is the measure of how much the price of a security fluctuates over time. Volatility can be used to identify opportunities to enter and exit trades.
Developing Price Action Trading Strategies
The best way to develop a price action trading strategy is to start by learning the basics. Once you have a good understanding of the basics, you can start to develop your own trading strategy.
There are many different ways to develop a price action trading strategy. Some traders prefer to use a simple approach that focuses on identifying trends and support and resistance levels. Other traders prefer to use a more complex approach that includes the use of candlestick patterns, volume analysis, and volatility analysis.
Once you have developed a trading strategy, it is important to backtest it on historical data. This will help you to identify any potential flaws in your strategy and to fine-tune it before you start trading live.
A stop-loss is an order that automatically closes your trade at a predetermined loss level. This will help you to limit your losses if your trade goes against you.
When you are in a winning trade, it is important to take profits. This will help you to lock in your gains and to avoid giving them back.
Price Action Analysis: Benefits and Advantages
There are multiple benefits and advantages of using price action analysis.
Price action analysis is a relatively simple approach to trading that can be learned by beginners.
Price action analysis can be used to trade a wide variety of assets, including stocks, forex, and cryptocurrencies.
Price action analysis is based on the belief that all the information that is needed to make a trading decision is contained in the price chart. This makes it a reliable approach to trading.
Price action analysis requires traders to be disciplined and to follow their trading plan. This can help to reduce emotions from trading and lead to better decision-making.
Here are some of the drawbacks of using price action analysis:
It takes time and effort to learn how to use price action analysis effectively.
Price action analysis is not always accurate. There will be times when the price action does not follow the expected pattern.
It can be difficult to identify trade setups using price action analysis. This is because the price action can be very volatile and unpredictable.
Tools and Techniques for Price Action Trading
Here are some of the most popular tools and techniques for price action trading:
Candlestick charts are a type of price chart that shows the open, high, low, and close prices for a security. They can be used to identify patterns that can help traders predict future price movements.
Moving averages are a type of technical indicator that averages price data over a period of time. Moving averages can be used to identify trends and support and resistance levels.
Volume is the number of shares or contracts, or assets that are traded over a certain time period. Volume can be used to measure the strength of a trend or to identify areas of support and resistance.
Volatility is a metric that quantifies how much the price of a share or an asset changes over a certain period of time. Volatility can be used to identify opportunities to enter and exit trades.
Support and resistance are levels on the price chart where buyers and sellers are likely to come into balance.
It is important to use multiple timeframes when using price action analysis. This will help you to identify trends and patterns that are not visible on a single time frame.
Candlestick Patterns and Their Interpretation
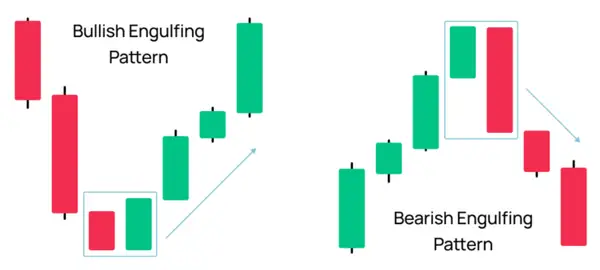
Candlestick patterns are a type of price pattern that can be used to identify potential trading opportunities. Candlestick patterns, like those contained in the Bitcoin price action chart below, are important because they can provide price action traders a visual representation of the underlying market sentiment.
For example, an engulfing pattern is a very common candlestick formation used to spot trend reversals and continuations after a pullback.
A bullish engulfing pattern is a reversal pattern that occurs when a large green candle engulfs a large red candle.
Bullish and Bearish Engulfing Patterns (source: Morpher.com)
This pattern is interpreted as a sign that the bulls are starting to take control of the market and that the price is likely to rise.
A bearish engulfing pattern is a reversal pattern that occurs when a large red candle engulfs a large green candle. This pattern is interpreted as a sign that the bears are starting to take control of the market and that the price is likely to fall.
Candlestick patterns can be used in conjunction with other technical analysis tools, such as moving averages and volume, to provide traders with a more comprehensive view of the market. By combining multiple technical indicators, traders can increase their chances of making profitable trades.
Here are some of the more important candlestick patterns for price action trading:
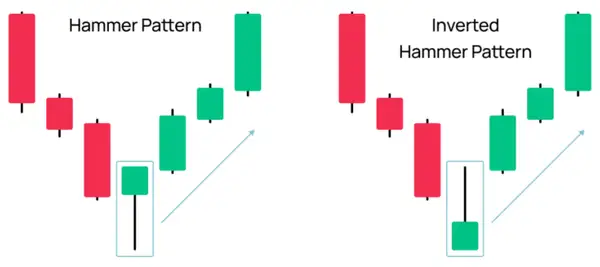
A hammer pattern is a bullish reversal pattern that occurs when a small body candle with a long lower shadow appears at the bottom of a downtrend.
Hammer Pattern (source: Morpher.com)
This pattern is interpreted as a sign that the bears are losing momentum and that the price is likely to rise.
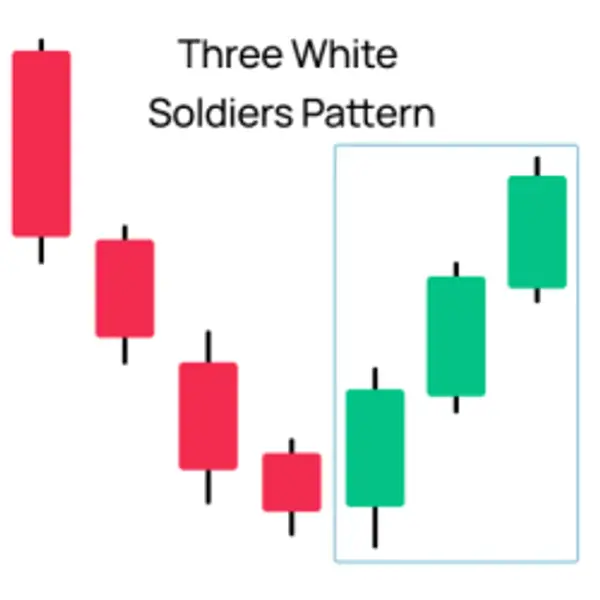
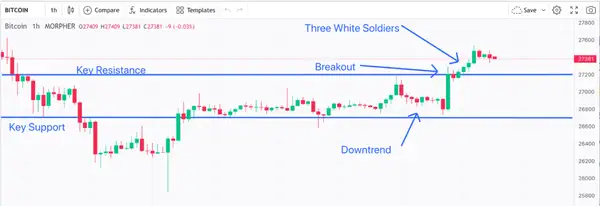
The three white soldiers candlestick pattern is a bullish reversal pattern that occurs after a downtrend. It consists of three consecutive green candles, each closing higher than the previous candle. The candles should have small upper and lower shadows, and the opening price of each candle should be within the body of the previous candle.
Three White Soldiers (source: Morpher.com)
The three white soldiers pattern indicates that the bulls are gaining control of the market and that the downtrend is likely to end. This pattern is often seen at the bottom of a downtrend but can also occur after a period of consolidation.
These are just a few of the more important candlestick patterns for price action trading. Many other patterns can be used, and the best approach will vary depending on the individual trader's preferences and style.
Support and Resistance Levels and Their Significance
Support and resistance levels are important technical analysis concepts that can be used to identify potential trading opportunities.
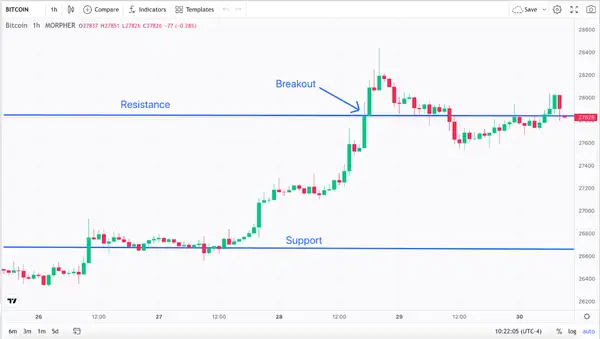
Resistance – Support Levels and Bitcoin 1-hour Price Chart (source: Morpher)
In the exemplary Bitcoin price chart illustrated above, a resistance level and a support level are illustrated. The support level is an area where buyers are likely to step in and prevent Bitcoin’s price from falling further. Resistance levels are areas where sellers are likely to step in and prevent the Bitcoin price from rising further.
A breakout occurs when Bitcoin breaks past this resistance level which now can act as a level of support. Here, a retest occurs where the price of Bitcoin retests the support level and then fails to hold this level. As such, this breakout may be referred to as a false breakout.
Support and resistance levels are formed by the interaction of supply and demand. When there is more demand than supply, the price will rise and test the resistance level. If the price is unable to break through the resistance level, it will likely fall back down to the support level.
Conversely, when there is more supply than demand, the price will fall and test the support level, as Ethereum did in the price action chart above. If the price is unable to break through the support level, it will likely rise back up to the resistance level.
Support and resistance levels can be used to identify potential trading opportunities in a number of ways. These levels can be used as one metric to confirm potential entry and exit points. They can also use support and resistance levels to identify potential trend reversals.
For example, a trader might enter a long trade when the price breaks through a resistance level. The trader would then place their stop-loss order below the support level. If the price breaks through the support level, the trader would exit the trade at a loss.
Support and resistance levels can also be used to identify potential trend reversals. A reversal being a change in a trend.
For example, a trader might exit a long trade when the price breaks through a support level. The trader would then place their stop-loss order above the resistance level. If the price breaks through the resistance level, the trader would exit the trade at a profit.
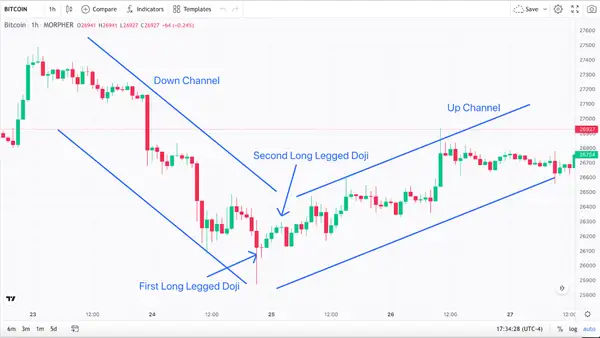
Trendlines and Channels for Identifying Market Trends
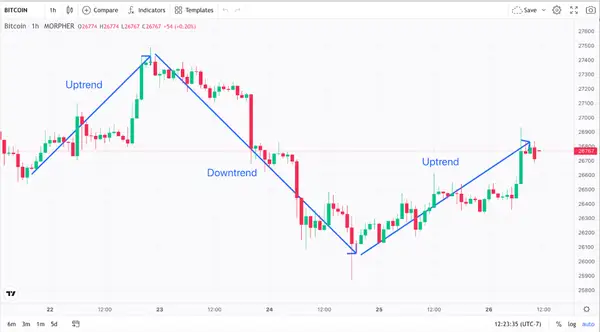
Trendlines are lines drawn on a chart to connect a series of highs or lows. They can be used to identify the direction of a trend and to identify potential entry and exit points. A bullish trend is an uptrend, and a bearish trend is a downtrend.
Trends and Bitcoin One-Hour Price Action Chart (source: Morpher.com)
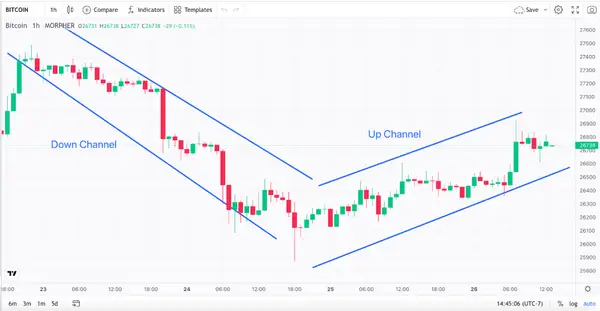
Channels are a type of trendline that is formed by connecting a series of highs (an up channel) and a series of lows (a down channel). Channels can be used to identify the direction of a trend and to identify potential trading ranges.
Channels and Bitcoin One-Hour Price Action Chart (source: Morpher.com)
Trendlines and channels are both used in price action trading to identify potential trading opportunities. Traders can use trendlines and channels to identify potential entry and exit points for their trades. They can also use trendlines and channels to identify potential trend reversals.
For example, a trader might enter a long trade when the price breaks out of a channel. The trader would then place their stop-loss order below the support level of the channel. If the price breaks through the support level, the trader would exit the trade at a loss.
Trendlines and channels can also be used to identify potential trend reversals. For example, a trader might exit a long trade when the price breaks down through a trendline. The trader would then place their stop-loss order above the resistance level of the trendline. If the price breaks through the resistance level, the trader would exit the trade at a profit.
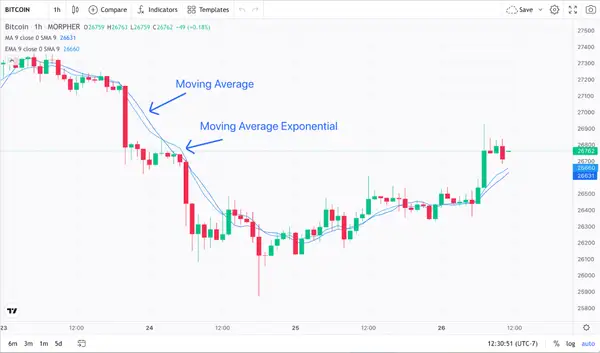
Moving Averages and Their Role in Price Action Analysis
A moving average (MA) is a technical analysis indicator that is used to smooth out price data by creating a line that is equal to the average price of a security over a specified number of periods.
Moving averages are used in price action analysis to identify trends, support and resistance levels, and potential entry and exit points.
There are many different types of moving averages, but the most common are the simple moving average (SMA or moving average) and the exponential moving average (EMA).
Moving Averages and Bitcoin One-Hour Price Action Chart (source: Morpher.com)
The SMA is calculated by adding up the closing prices of a security over a specified number of periods and dividing by the number of periods. The EMA is calculated by giving more weight to recent price data than to older price data.
Moving averages can be used to identify trends by looking for the direction of the slope of the moving average line. A moving average that is rising denotes an uptrend, while a moving average that is falling denotes a downtrend.
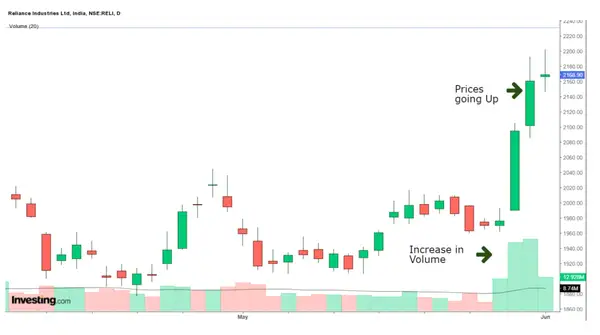
Volume Analysis and its Impact on Price Movements
Volume analysis is a technical analysis method that uses the volume of trading to identify trends and patterns in the market.
Volume is the number of shares or contracts that are traded in a given period of time. It is an important indicator of market sentiment, as it shows how much interest there is in a particular security.
When volume increases, it indicates that there is interest in the security and that prices are likely to continue to move in the current direction.
When volume is low, it indicates that there is not much interest in the security and that the price is likely to be more volatile.
Volume analysis can be used to identify trends and patterns in the market. For example, if volume is increasing as the price is rising, it indicates that the trend is likely to continue. Alternatively, if the price is in an uptrend while the volume is in a downtrend, this implies that a potential reversal is likely.
Additionally, support and resistance levels can be identified through volume analysis. Support levels are areas where buyers are likely to step in and prevent the price from falling further. Resistance levels are areas where sellers are likely to step in and prevent the price from rising further.
When volume is high at support levels, it indicates that there is a lot of buying interest and that the price is likely to bounce off the support level. Conversely, when volume is low at these levels, it indicates that there is not much buying interest and that the price is likely to break through the support level.
The same is true for resistance levels. When volume is high at resistance levels, it indicates that there is a lot of selling interest and that the price is likely to fall back from this level. Conversely, when volume is low at resistance levels, it indicates that there is not much selling interest and that the price is likely to break through this level.
Price Action Strategies
Confluence and Price Action
One of the most effective ways to find confluence while price action trading is by combining two or more technical indicators to identify an entry point. In this manner, multiple indicators that provide consistent market signals help to confirm whether or not to enter the trade.
The Bitcoin price action chart above illustrates a downtrend followed by an uptrend. Here, the downtrend ends with a first long-legged doji at the base of a downtrend. This long-legged doji is a candle that comprises long upper and lower shadows and has roughly a similar opening and closing price.
When a doji appears following a significant advance or decline, the pattern demonstrates indecision and can be most significant. Some traders may take action based on the one-candle pattern, while others want to see how the price reacts to the long-legged doji.
Here, the Bitcoin price reacts to the long-legged doji with the formation of three straight bullish candles. However, traders who wish to enter a long trade here should heed caution. For example, this three-candle stick pattern is formed by a number of adjacent bullish candles having smaller wicks and whose opening price and closing prices demonstrate an upward trend over the previous candle.
However, in this particular situation, the second bullish candlestick in the pattern has a smaller body than its previous candlestick and the third bullish candlestick has a smaller body than its previous bullish candlestick.
This pattern can be interpreted as a stalled pattern where the bulls provide a weak sentiment and where Bitcoin’s price momentum is beginning to fade. That means a price reversal is possible.
And also, note the formation of a second long-legged doji after the third bullish candlestick at the conclusion of this three candlestick short uptrend. This second doji is yet another indication of indecision or a potential reversal. As such, traders should heed caution if considering entering a trade at this point.
Price Action and Breakouts
Breakout trading involves entering a position when an asset appears to be breaking out of a range. For example, as illustrated below, Bitcoin is noted to break out of a certain key resistance level. This breakout presents another entry point for entering a long position.
The formation of another three white soldiers pattern represents a bullish reversal pattern as described previously. This bullish formation provides a reliable breakout indicator when formed immediately after a downtrend. In addition, this reliable breakout indicator was configured by the formation of a positive uptrend.
Risk Management in Price Action Trading
Traders implement risk management to identify and control risks. It is an essential part of any trading strategy, as it can help you to protect your capital and avoid losses.
In price action trading, risk management is particularly important, as the price of a security can move quickly and unexpectedly. By using risk management techniques, you can increase your chances of success and protect your capital from losses.
There are a number of risk management techniques that can be utilized, including:
A stop-loss is an order that automatically closes your trade at a predetermined loss level. This will help you to limit your losses if your trade goes against you.
A profit target is an order that automatically closes your trade at a predetermined profit level. This will help you to lock in your gains and avoid giving them back.
Traders use position sizing to limit the amount of capital to risk on each trade. It is important to only risk a small percentage of your account on each trade, as this will help you to protect your capital from losses.
Diversification is the process of spreading your risk across a variety of assets. This will help to reduce your overall risk and protect your capital from losses.
By using risk management techniques, traders can increase their chances of success and protect their capital from losses. It is important to remember that no risk management technique is perfect, and you can still lose money even if you use them.
Setting Stop-loss and Take-Profit Levels Based on Price Action
Setting stop-loss and take-profit levels based on price action involves using an asset’s price movement to determine appropriate levels for risk management and profit-taking. Here's a detailed process for setting stop-loss and take-profit levels based on price action.
Start by identifying significant support and resistance levels. These levels represent areas where the price has historically had difficulty moving beyond or has shown a tendency to reverse. They act as psychological barriers in the market and are important reference points for setting stop-loss and take-profit levels.
Next, determine your desired risk-reward ratio for the trade. This ratio represents the potential profit you're willing to gain relative to the potential loss you're willing to tolerate.
A common rule of thumb is to aim for a risk-reward ratio of at least 1:2, meaning your potential profit is twice the size of your potential loss.
Here is a risk-reward example.
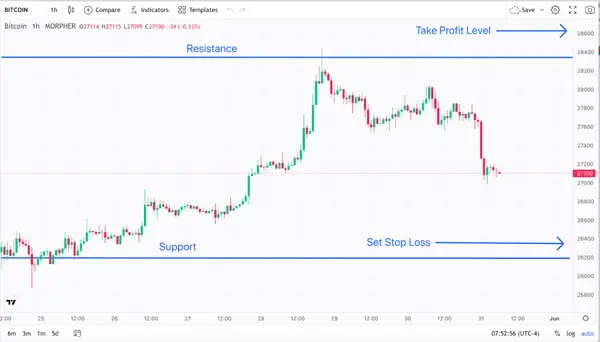
Example Risk-Reward Ratio One-Hour Bitcoin (source: Morpher.com)
Let's assume the current price of Bitcoin is $27,100, and you want to enter a trade with a stop loss and take profit levels based on a risk-reward ratio of 1:2.
First, you determine that the potential loss you are willing to take on this trade is $750. Therefore, you set your stop loss at $26,350 ($27,100 – $750). This stop loss is just above the key support level.
Based on the risk-reward ratio of 1:2, your potential profit should be twice the size of your potential loss. Since your potential loss is $750, your potential profit should be $1,500 ($750 x 2). Therefore, your take profit level will be $28,600 ($27,100 + $1,500), slightly above the key resistance level.
Based on price action analysis, you can set a stop-loss level just below a support level if you're going long (buying) or just above a resistance level if you're going short (selling). This helps protect your capital in case the price breaks through the support or resistance level, indicating a potential trend reversal.
The take-profit level is the price at which you plan to exit the trade to secure your profits. You can set your take-profit level based on key resistance or support levels, trendlines, or other chart patterns that suggest a potential reversal or significant price movement. Alternatively, you can use a trailing stop strategy, where your take-profit level adjusts dynamically as the price moves in your favor.
It's important to monitor your trades regularly and adjust your stop-loss and take-profit levels if necessary. If the price action suggests a change in the market direction or the emergence of new support and resistance levels, you may need to modify your levels to align with the evolving price dynamics.
Position Sizing and Risk-Reward Ratio Considerations
Traders use position sizing to limit the amount of capital to risk on each trade. It involves assessing the risk associated with a trade and determining the appropriate position size based on the trader's risk tolerance and account size.
Traders should evaluate their personal risk tolerance, which reflects their willingness and ability to withstand potential losses. A higher risk tolerance may allow for larger position sizes, while a lower risk tolerance may warrant smaller positions.
The size of the trading account is a critical factor in position sizing. Generally, it's advisable to risk a small percentage of the account capital per trade to ensure diversification and avoid significant drawdowns.
The placement of the stop-loss level, determined through price action analysis, plays a crucial role in position sizing. A tighter stop-loss allows for a larger position size since the potential loss per trade is smaller. Conversely, a wider stop-loss necessitates a smaller position size to maintain risk within acceptable limits.
The risk-reward ratio measures the potential reward of a trade relative to the potential risk of the trade. It provides a quantitative assessment of the trade's attractiveness and helps traders assess whether the potential reward justifies the risk taken.
Based on price action analysis, determine the potential target or take-profit level for the trade. This level is typically set by identifying key support or resistance areas, trendlines, or other chart patterns that suggest a potential reversal or significant price movement.
To calculate the risk-reward ratio, divide the potential profit (distance between entry and target) by the potential loss (distance between entry and stop-loss).
It's essential to assess the overall win rate of your trading strategy. A higher win rate allows for smaller risk-reward ratios, as more winning trades can compensate for a smaller reward.
Conclusion
Price action trading is a powerful and versatile trading strategy that can be used to trade a wide variety of markets. It is an effective way to identify trends and reversals, and it can be used to trade both long and short positions. If you are new to trading, we encourage you to practice price action techniques. With a little practice, you can learn to use price action to make profitable trades.
Disclaimer: All investments involve risk, and the past performance of a security, industry, sector, market, financial product, trading strategy, or individual’s trading does not guarantee future results or returns. Investors are fully responsible for any investment decisions they make. Such decisions should be based solely on an evaluation of their financial circumstances, investment objectives, risk tolerance, and liquidity needs. This post does not constitute investment advice.
Painless trading for everyone
Hundreds of markets all in one place - Apple, Bitcoin, Gold, Watches, NFTs, Sneakers and so much more.
Painless trading for everyone
Hundreds of markets all in one place - Apple, Bitcoin, Gold, Watches, NFTs, Sneakers and so much more.
Subscribe now to our newsletter to get critical insights and analysis: