Range Trading 102: Advanced Techniques and Updated Strategies
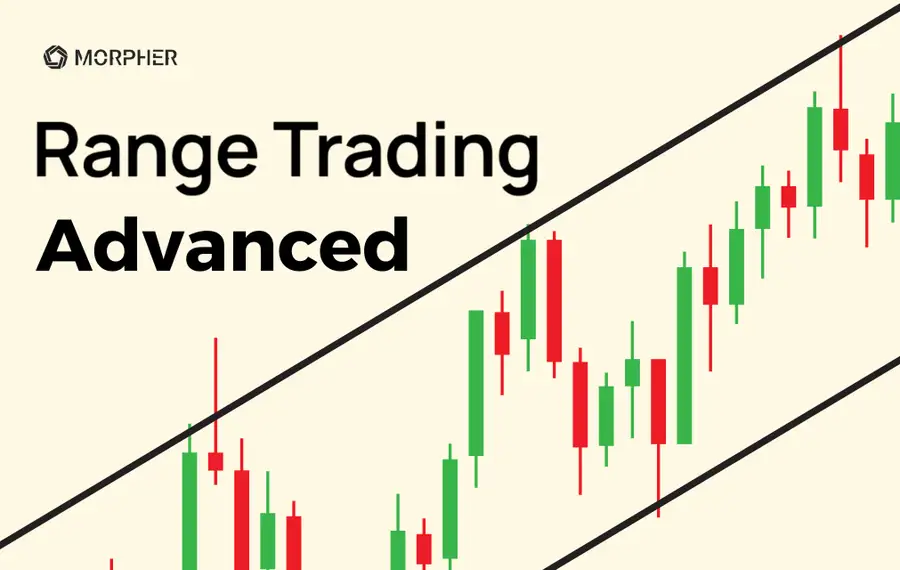
Welcome back! If you’ve mastered the basics from our Range Trading 101 Guide, you’re ready for the next step. This article, “Range Trading 102: Advanced Techniques and Updated Strategies,” is designed to take your range trading skills to the next level.
In the 101 guide, we covered the essentials—how to identify stocks or securities that move within a specific price range, and key strategies involving support and resistance levels, Bollinger Bands, oscillators like the RSI, and price action.
In Range Trading 102, we’ll go beyond the fundamentals and explore precision tools and nuanced strategies that can help you extract optimal profit from range-bound markets. Whether you're struggling with false breakouts or looking to improve your risk management, this guide provides practical, real-world techniques for advanced traders.
Advanced Range Trading Concepts
Identifying Reliable Support and Resistance Levels
Support and resistance levels act as critical markers in range trading. It's essential to accurately identify these levels to increase the probability of successful trades. One technique that advanced traders employ is using multiple time frames to confirm support and resistance areas. This approach provides a more comprehensive view of the market and reduces the chances of falling victim to false breakouts.
Key Techniques:
- Fibonacci Retracement + Volume Profile: Combining Fibonacci retracement with volume profile can help refine the identification of key levels. The volume profile highlights high trading activity zones, helping you differentiate between weak and strong support or resistance.
- Timeframe Confluence: By analyzing multiple timeframes, you ensure that support and resistance levels identified on smaller charts are confirmed on higher timeframes, reducing the chances of false breakouts.
Example: Let’s say you’re range trading on a 1-hour chart. You identify resistance at $50 and support at $45. Confirm these levels by checking the 4-hour and daily charts. If these zones hold on multiple timeframes and align with Fibonacci retracement and volume spikes, they are likely to be more reliable.
False Breakouts and How to Handle Them
False breakouts are common in range trading and can be frustrating for traders. However, there are strategies to effectively handle them and minimize losses. One approach is to wait for a retest of the breakout level before entering a trade. This confirmation helps filter out false signals and increases the probability of success.
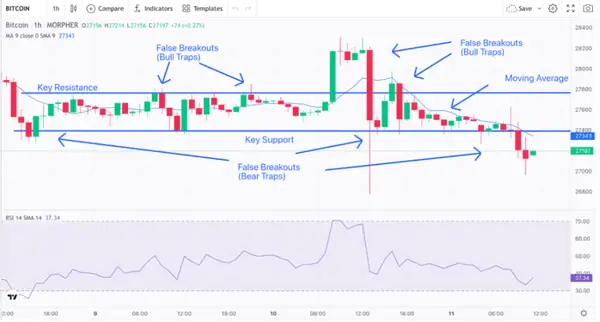
Another technique is to analyze the volume accompanying the breakout. If there is a lack of significant volume supporting the breakout, it may be a sign of a false breakout. By incorporating volume analysis into your range trading strategy, you can better gauge the authenticity of breakouts.
Key Techniques:
- Order Flow Analysis: By analyzing the real-time buy and sell orders, you can assess whether a breakout is supported by genuine market momentum or if it's just a liquidity grab.
- Retesting Breakouts: Wait for the market to retest the breakout level. A failed retest often signals a false breakout. Advanced traders only enter after this confirmation, combining it with high-volume spikes for validation.
Example: If you notice a breakout through resistance on the 1-hour chart, wait for a pullback to the breakout level. If the price retests this level and volume increases, the breakout is more likely to be real. However, if the retest fails and volume diminishes, it’s often a false breakout, and you can avoid entering or even reverse your position.
Volume Analysis in Range Trading
Volume analysis plays a vital role in range trading, as it provides insights into the intensity of buying and selling pressure. By monitoring volume patterns within the range, traders can gauge the market sentiment and make informed trading decisions.
Key Techniques:
- Volume Profile Analysis: This tool allows you to see where most trading activity occurred within the range. These high-activity zones often act as support or resistance levels.
- Cumulative Delta: This indicator measures the difference between buying and selling pressure. When cumulative delta aligns with price movements, it confirms the strength of the trend within the range.
Example: If price nears a support level with decreasing volume and cumulative delta shows stronger buying pressure, it’s a strong indicator that the support level will hold. Conversely, if you see a spike in selling pressure near a resistance level, it signals a possible reversal or breakout.
Developing an Advanced Range Trading Strategy
You’ve already gained foundational knowledge from our Range Trading 101 Guide. Before diving into new strategies, let’s recap the three crucial factors you need to consider when developing your range trading strategy.
Factors to Consider in a Range Trading Strategy
- Market Volatility:
High volatility can lead to more frequent breaches of support or resistance levels, resulting in false breakouts. Managing volatility is key to maintaining effective range boundaries. - Timeframes:
Range trading can be executed on various timeframes. Choose one that fits your trading style and availability, whether it’s intraday, daily, or weekly. - Confirming Indicators:
Use technical indicators such as moving averages or oscillators to validate the range and identify potential entry and exit points. These tools help ensure your trades are based on solid data.
Key Techniques
- Volatility-Based Ranges: Instead of using static price levels, use tools like Keltner Channels or Donchian Channels that automatically adjust based on volatility.
- ATR (Average True Range) for Stop-Losses: In volatile markets, setting stop-losses using ATR prevents you from being stopped out by normal price fluctuations. Adjust the size of your stops according to the current ATR, allowing you to ride out volatility without overexposing your account to risk.
Example: Let’s say the ATR for your asset has increased to 2 points. You would adjust your stop-loss to 2x ATR, placing it at 4 points away from your entry, to allow the market to breathe during volatile periods without prematurely stopping your trade.
Range Trading in Trending Markets: Combining Trend and Range Strategies
In trending markets, prices may still oscillate within a defined range while following the broader trend. The key here is to trade within the range while respecting the trend’s direction. Advanced traders use Fibonacci retracement levels or trend-based channels to identify temporary ranges within the trend.
Key Techniques:
- Trendline + Range Integration: Use trendlines to define the overall direction, then trade within the range using support and resistance levels that align with the trend.
- Pullback Ranges: Use Fibonacci retracement to identify potential pullback zones within a trending market. Once identified, trade within these temporary consolidation zones for quick profits.
Example: In an uptrend, the price may pull back to a 61.8% Fibonacci retracement level. If you spot a range forming at this level, you can trade between the support and resistance of that range, capitalizing on the consolidation before the trend resumes.
Advanced Risk Management Techniques
Mastering risk management is the cornerstone of successful range trading. Advanced traders go beyond basic stop-losses and position sizing, using tools like Kelly Criterion or Optimal F to calculate the optimal position size per trade.
Key Techniques:
- Position Sizing with Kelly Criterion: The Kelly Criterion helps determine the optimal size of your trades based on your win rate and risk/reward ratio, maximizing long-term profitability.
- Advanced Stop-Loss Management: Instead of using static stop-losses, advanced traders use trailing stops or volatility-adjusted stops to adapt to market conditions.
Example: If you’ve calculated your optimal position size using the Kelly Criterion, you may find that you should risk 2% of your capital per trade. Using ATR to adjust your stop-losses ensures that you maintain this risk percentage while accommodating volatile markets.
Tools and Resources
Morpher provides everything you need for advanced range trading. Sign up today and unlock a powerful platform designed to elevate your trading strategy to new heights!
Features: Advanced charts with over 50 technical indicators, customizable alert settings, and free access to Morpher AI.
Benefits:
Provides detailed market insights for crypto, stocks, commodities, and more.
User-friendly interface for setting up alerts at specific price levels and indicator conditions.
Morpher AI offers real-time analysis and market updates at no additional cost.
FAQ
What is range trading?
Range trading is a strategy where traders take advantage of price fluctuations within a defined trading range. It involves buying near support levels and selling near resistance levels.
How do I identify support and resistance levels?
To identify support and resistance levels, analyze historical price data and look for areas where the price tends to bounce off or retreat from. Connect the significant highs and lows on the chart to draw support and resistance lines.
What are the key factors to consider in a range trading strategy?
In a range trading strategy, consider market volatility, choose a suitable timeframe, and use confirming indicators to identify potential trades within the range.
What are the common pitfalls in range trading?
Common pitfalls in range trading include psychological challenges, such as impatience and emotional decision-making, and neglecting to adapt to changing market conditions. Avoid these pitfalls by maintaining discipline and sticking to your trading plan.
Are technical indicators useful in range trading?
Yes, technical indicators can be helpful in range trading. Indicators like the RSI and Bollinger Bands can provide confirmation and help identify potential entry and exit points.
Ready to take your range trading to the next level with a platform designed for the modern trader? Look no further than Morpher, the revolutionary trading platform that leverages blockchain technology to offer zero fees, infinite liquidity, and a multitude of trading opportunities across various asset classes. Whether you're interested in stocks, cryptocurrencies, or even niche markets like NFTs, Morpher's unique features such as fractional investing, short selling without interest fees, and up to 10x leverage can help you maximize your trading strategies. Experience the future of investing with the safety and control of the Morpher Wallet. Sign Up and Get Your Free Sign Up Bonus today to transform the way you trade!

Disclaimer: All investments involve risk, and the past performance of a security, industry, sector, market, financial product, trading strategy, or individual’s trading does not guarantee future results or returns. Investors are fully responsible for any investment decisions they make. Such decisions should be based solely on an evaluation of their financial circumstances, investment objectives, risk tolerance, and liquidity needs. This post does not constitute investment advice.

Painless trading for everyone
Hundreds of markets all in one place - Apple, Bitcoin, Gold, Watches, NFTs, Sneakers and so much more.

Painless trading for everyone
Hundreds of markets all in one place - Apple, Bitcoin, Gold, Watches, NFTs, Sneakers and so much more.

