
Are you tired of sitting on the sidelines while the markets make moves without you? Well, break out of that slump and into breakout trading strategies!
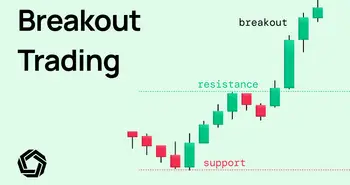
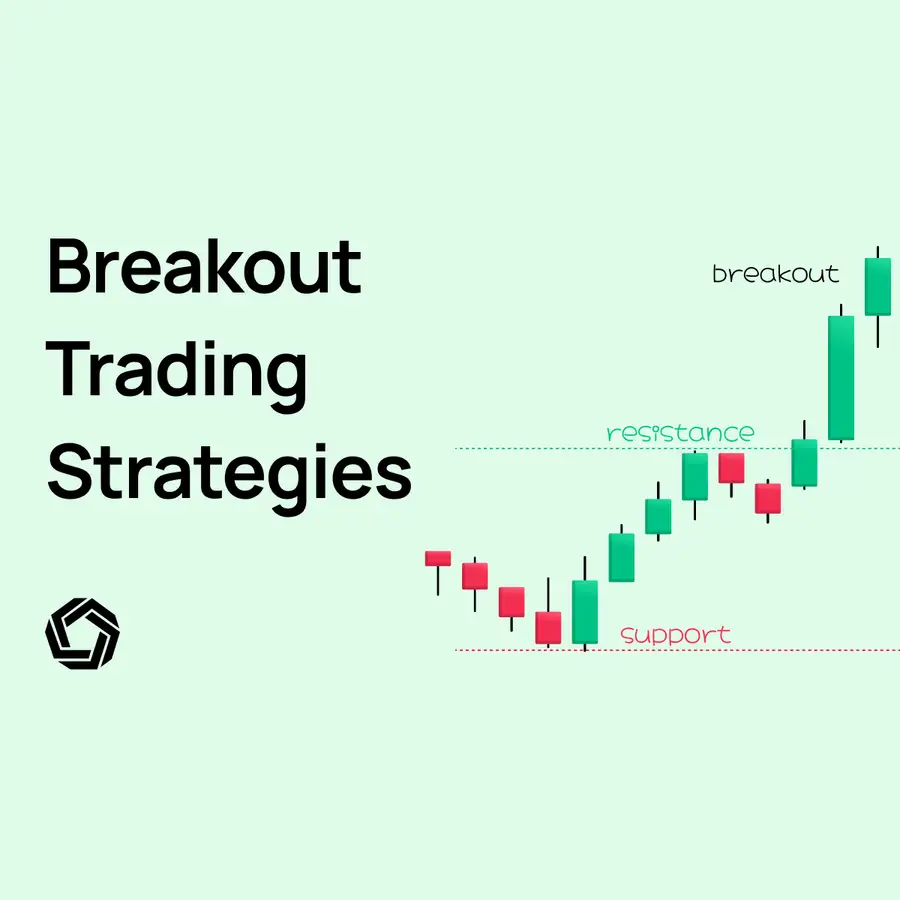
To put it in simple terms, breakout trading is about identifying critical levels of support and resistance on a chart and then opening trades when the price breaks through those levels. The main goal is to find those favorable spots in the market and seize the opportunities they present.
Breakout trading is a popular trading strategy that seeks to profit from price movements that occur when an asset’s price breaks through established support or resistance levels. The main goal of breakout trading is to find those favorable spots in the market and seize the opportunities they present.
In this article, I'll guide you through everything you need to know about breakout trading in plain and easy-to-understand language, so you can leverage this strategy to improve your trading skills.
Think of it like a game of chess. You need to know the rules and the moves to make in order to win the game. And as with any game, you need to manage your risk. We'll also cover essential risk management techniques, like position sizing, managing emotions, and understanding market volatility, to help you stay in the game and avoid big losses.
So, are you ready to break out of the pack and take your trading to new heights? Let's dive into mastering breakout trading strategies.
Key Elements of Breakout Trading Strategies
Here are the key elements of breakout trading strategies:
Identifying key support and resistance levels
The first step in implementing a breakout trading strategy is identifying key support and resistance levels. Support levels are price levels where buyers are expected to enter the market and prevent further price declines. Resistance levels, on the other hand, are price levels where sellers are expected to enter the market and prevent further price increases. Identifying these levels can be done by analyzing historical price charts and observing where price tends to stall or reverse.
Support and resistance levels are the first step you should master when trading breakout setups. These levels are like the foundation of an asset's price movement, where buyers and sellers come together to either keep the price from falling further or prevent it from increasing beyond a certain level. By analyzing the historical price charts and observing where the price tends to hit a wall or reverse, we can identify these levels.
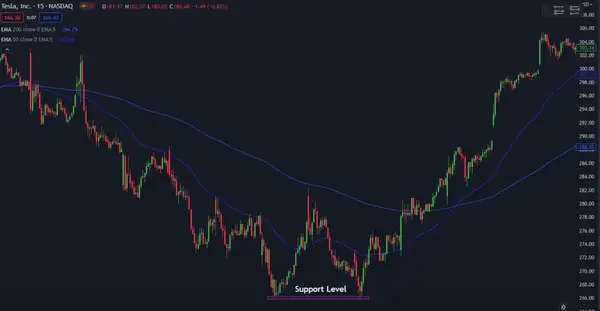
Below is a great example of a strong support zone on Tesla’s stock chart. The price couldn't break through the support level and instead triggered a trend reversal. This is a classic example of how support levels can act as a safety net for traders, preventing further price declines and signaling potential buying opportunities.
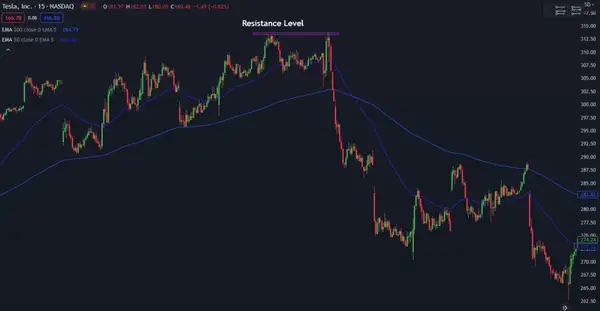
And the following is an example of resistance level where the price failed to break on the upside and instead it triggered a trend reversal.
Analyzing trading volume
Analyzing trading volume is an essential part of breakout trading as it helps to confirm the validity of a breakout. High trading volume during a breakout indicates that there is significant buying or selling pressure, which can be a signal of a strong trend. It's like a crowded restaurant where everyone is eager to get a table. There's a high likelihood that the food is great.
Identifying trend lines and chart patterns
To identify potential breakout levels, breakout traders commonly employ trend lines and chart patterns in their analysis.
You can draw trendlines by connecting the high or low points of a series of prices on a chart. These lines help you determine the direction in which the price is moving, just like a compass helps you navigate. Trendlines also give you valuable insight into the support and resistance levels of an asset. If the price breaks through a trendline, it can indicate a potential change in the market's behavior, making it a strong signal of a breakout.
Chart patterns are created by the convergence of multiple trend lines and can provide valuable insights into market sentiment. These patterns are created when multiple trend lines converge and can indicate potential breakouts or trend reversals. By combining chart patterns with other technical analysis tools, you can identify key support and resistance levels and improve the accuracy of your trading strategy.
Choosing the right entry and exit points
Candlestick patterns are a powerful tool for breakout traders when seeking ideal entry and exit points. These patterns can offer valuable information about price action and help you determine the trend's strength and potential reversal points.
For example, a bullish candlestick pattern such as a hammer or bullish engulfing pattern can signal a potential long entry point. Similarly, a bearish candlestick pattern such as a bearish engulfing pattern can signal a potential short entry point.
As a breakout trader, it's essential to master the art of reading and interpreting candlestick patterns, as they can help pinpoint more accurately entry and exit points.
Breakout Trading Strategy Ideas
Trendline Breakouts
As the name suggests, a trendline breakout strategy is a trading approach that involves identifying a trendline on a chart and then waiting for the price to break through that trendline before entering a trade.
More aggressive traders often enter a trade as soon as the first candle closes above a descending trendline or below an ascending trendline. The main issue with this approach is that you are exposing yourself to more risk, because false breakouts also happen and they will result in lost trades more often.
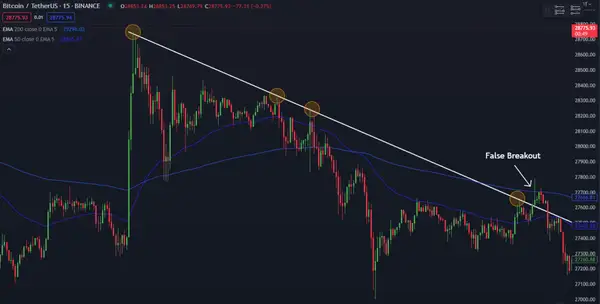
In the BTC chart below, you can see an example of a trendline breakout where the price closed above the descending trendline. However, this breakout turned out to be false, resulting in a loss for traders who entered the trade based on this signal.
Moreover, the candlestick that formed at breakout is a bearish pin bar pattern, suggesting a potential decrease in price in the near future. Which happened very soon after the breakout.
If you want to carry less risk, consider waiting for additional confirmation from another technical indicator or candlestick pattern. This can provide greater confidence in the validity of the trendline breakout signal and increase the chances of a successful trade.
In the case of the BTC trendline breakout from above, the bearish pin bar would invalidate the signal to go long after the breakout. As a result, we would skip this trade and avoid the loss.
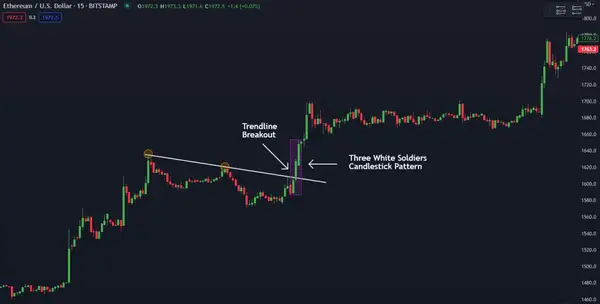
The ETH/USD chart below provides a great example of how to use trendlines and candlestick patterns to identify accurate entry points. Upon trendline breakout, a three white soldiers pattern formed, which suggested that the price was likely to continue its upward trajectory. And up it went. A good entry point would be right above the three white soldiers pattern.
Moving Average Breakouts
A moving average is a line that shows the average price of an asset over a specified period. Traders using a moving average breakout strategy would look for instances where the price of an asset breaks through this moving average line as a signal to enter a trade in the direction of the breakout.
Same as with trendline breakouts, more aggressive trades would enter a trade right after the trendline is broken, while more conservative traders would wait for additional confirmation.
Moving average breakout strategies can be applied to various markets, including stocks, crypto, forex, and commodities.
Let's explore how a moving average breakout strategy can be applied to a real chart using the 200 exponential moving average (EMA).
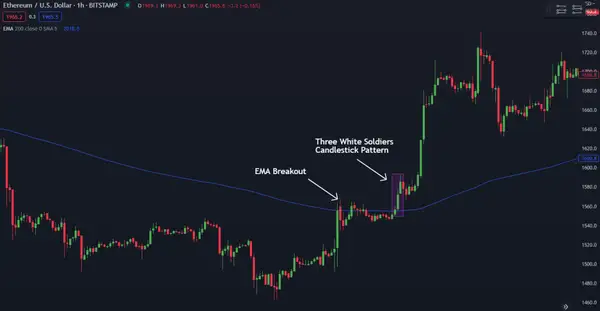
In this example, both aggressive and conservative types of traders could potentially profit from this signal. The EMA breakout occurs when the price closes above the 200 EMA line. Aggressive traders may choose to enter a long position immediately after the hourly candle is formed.
Alternatively, conservative traders may prefer to wait and seek additional confirmation. In this case, after several hours of waiting, a bullish three white soldiers pattern emerged. A long position could be taken once this pattern was confirmed, indicating a potential continuation of the uptrend.
Channel Breakouts
The channel breakout strategy is based on the idea that prices tend to trade within a range or channel, moving up and down between a support level (the bottom of the channel) and a resistance level (the top of the channel). Once the price breaks out of this range, either above the resistance level or below the support level, it indicates a potential trend reversal or a continuation of the current trend.
This is an example of a channel breakout setup:
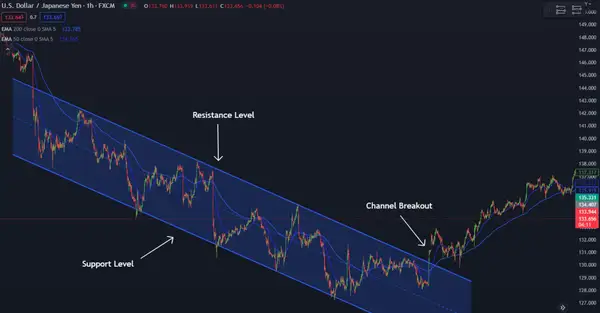
When the price breaks out of the channel, traders will often look for additional confirmation before entering a long or short position, just to make sure they don’t fall into the trap of a false breakout. In our example, an additional confirmation could be a bullish candlestick pattern such as a pin bar or engulfing candlestick, a moving average crossover, or an increase in momentum.
Channel breakout strategies require a lot of patience and a deep understanding of market cycles, technical analysis, risk management, and discipline.
Commonly Asked Questions about Breakout Trading
What is the best timeframe for breakout trading strategies?
The best time frame for breakout trading strategies really depends on your trading style, risk tolerance, and the market you want to trade. In general, shorter timeframes, such as the 15-minute or 30-minute charts, can provide more frequent breakout opportunities but may also result in more false breakouts. If you plan to trade within short timeframes, consider using tighter stop-loss orders to cut those losses short.
Longer time frames, such as the daily or weekly charts, can offer more reliable breakouts but may require more patience as they don’t happen that often.
Can breakout trading strategies be used in all market conditions?
Breakout trading strategies can be used in most market conditions, be it trending, ranging, or volatile markets. However, the effectiveness of the strategy may vary depending on the market conditions. In volatile markets you should consider adjusting your risk management strategy to account for the sudden price jumps and avoid excessive losses.
How do I determine my risk-reward ratio in breakout trading strategies?
To determine the risk-reward ratio in breakout trading, you need to set stop-loss and take-profit levels for each trade. The risk-reward ratio is basically the proportion of potential profit to the amount of risk undertaken to achieve that profit.
Conclusion
Breakout trading is a great trading strategy that seeks to profit from price movements that occur when an asset's price breaks through established support or resistance levels. In this article, we have covered the essential components of breakout trading and explored the main breakout strategies used in trading. It's now up to you to utilize this knowledge, develop your own breakout trading approach, conduct backtesting and optimization, and ultimately add it to your trading toolbox.

Disclaimer: All investments involve risk, and the past performance of a security, industry, sector, market, financial product, trading strategy, or individual’s trading does not guarantee future results or returns. Investors are fully responsible for any investment decisions they make. Such decisions should be based solely on an evaluation of their financial circumstances, investment objectives, risk tolerance, and liquidity needs. This post does not constitute investment advice.

Painless trading for everyone
Hundreds of markets all in one place - Apple, Bitcoin, Gold, Watches, NFTs, Sneakers and so much more.
Painless trading for everyone
Hundreds of markets all in one place - Apple, Bitcoin, Gold, Watches, NFTs, Sneakers and so much more.