
Introduction
False breakout trading involves entering a position when an asset appears to be breaking out of a range but then quickly reverses and moves back within the range.
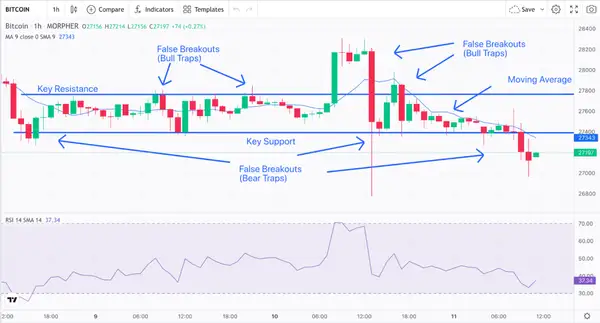
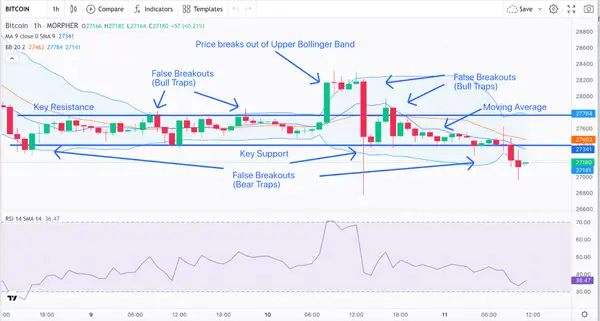
For example, the following Bitcoin price action chart illustrates two types of false breakouts (“fakeouts”): bull traps and bear traps. A bull trap is where Bitcoin crosses a key resistance and then pulls back after a short period of time.
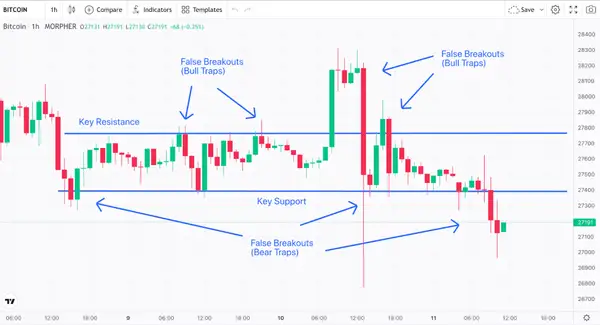
False Breakouts Bitcoin 1-Hour Chart (source: Morpher.com)
A bear trap represents a bearish trend where Bitcoin moves below a key support and then returns back to that support. Note that both the bull traps and the bear traps identified above signal the beginning of a new trend, and the end of a current trend.
Also note that on May 10th at 12:00, Bitcoin experienced a strong inverted hammer candle, a green bearish candlestick formation having a short body and a long upper wick. This inverted hammer appears after a decline, which makes it a bullish reversal pattern. Here, this reversal candle is a sign that Bitcoin is about to reverse direction. Which it did.
False breakout trading aims to capture profits from the market's reaction to false breakouts, such as those identified above. This occurs by traders buying and/or selling Bitcoin as it reverses direction.
Understanding False Breakouts
False breakouts occur quite frequently and can be costly for traders who are not prepared for them. For example, in the Bitcoin example provided above, Bitcoin experienced almost a dozen false breakouts in a matter of just 12 hours.
False breakouts can lead to losses when traders enter positions based on a perceived breakout, only to have the market quickly reverse and move back within the range.
Traders should heed the following tips to avoid false breakouts.
- It's important to remember that trading is a business, and emotions should be left at the door. Don't let fear or greed cloud trading judgment.
- A stop loss is an order that is automatically executed when an asset’s price reaches a certain level. Use stop losses to limit potential losses.
- Leverage is a tool that can be used to magnify your profits, but it can also magnify losses. It's important to use leverage responsibly and to never risk more than you can afford to lose.
- Don't be afraid to take profits when you're in a winning trade. Don't get greedy and try to hold onto a trade for too long.
In this blog post, we will explore the intricacies of false breakout trading, including what it is, how it works, and what strategies traders can use to maximize their chances of success.
Common Factors Contributing to False Breakouts
Market Manipulation
Market manipulation involves the intentional effort to artificially influence the price of an asset by using tactics such as spreading rumors, buying or selling large amounts of the asset, or engaging in other deceptive practices.
For example, Bitcoin whales may artificially inflate the price of Bitcoin by purchasing large amounts of Bitcoin. This can create a perceived breakout above a key Bitcoin resistance level. Other Bitcoin traders may then follow suit, believing that Bitcoin is trending upwards, and enter into long positions. However, once the Bitcoin whales have sold off their positions, the price of Bitcoin may quickly reverse, leading to a false breakout.
Lack of Liquidity
Liquidity refers to the ease with which an asset can be bought or sold in the market. When an asset has high liquidity, there are many buyers and sellers in the market, making it easier for traders to execute trades and for prices to reflect genuine market trends. Conversely, in a low liquidity environment, it will be more difficult to execute trades and prices can be more prone to manipulation or false signals.
For example, let's say that there is only $1 million worth of Bitcoin available to trade on a particular exchange. If a Bitcoin whale wants to create a false breakout, they could simply buy $1 million worth of Bitcoin at once. This would cause the price to go up significantly, even though there is no real demand for Bitcoin at that price. Once the whale has bought the Bitcoin, they can then sell it all at once, causing the price to crash.
Overreliance on Technical Indicators
Overreliance on technical indicators is a common factor contributing to false breakouts. When traders rely too heavily on technical indicators, they may be more likely to enter trades that are not in the best interests of their portfolio.
There are a number of reasons why overreliance on technical indicators can lead to false breakouts.
First, technical indicators are lagging indicators. They only reflect what has already happened in the market, not what is likely to happen in the future.
Second, technical indicators can be manipulated by market participants. Deep-pocketed large institutions can buy or sell large amounts of an asset to create the appearance of a trend.
And finally, technical indicators can be misinterpreted since there is no one-size-fits-all approach to technical analysis. What works for one trader may not work for another.
For example, one common technical indicator that can be misinterpreted is the moving average. It calculates the average price of an asset over a certain time period.
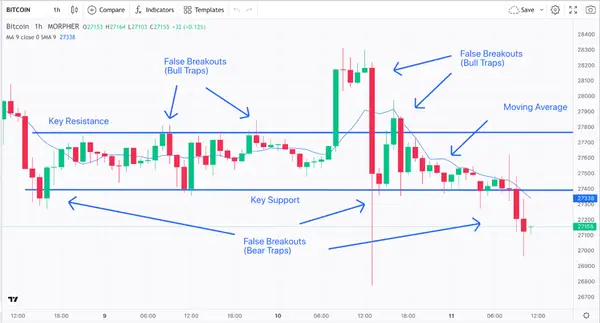
Resistance, Support, Moving Average, and False Breakouts Bitcoin 1-Hour Chart (source: Morpher.com)
When the price of Bitcoin crosses above or below this moving average, it can be interpreted as a signal that Bitcoin is breaking out of a range. Note how this occurred during the strong bull trap where a long green candlestick initiates the breakout to the upside. However, if Bitcoin’s price movement is not supported by genuine market trends, the breakout may be false.
Another example of over-reliance on technical indicators is when traders use a single indicator in making trading decisions. For instance, a trader may rely solely on the RSI to identify overbought or oversold conditions of an asset, without considering the impact of external factors such as news releases or economic indicators. This could lead to a false breakout if the RSI gives a false signal due to a lack of underlying market trends.
RSI, Resistance, Support, Moving Average, and False Breakouts Bitcoin 1-Hour Chart (source: Morpher.com)
Here, for example, the RSI does not provide a strong indication of either an overbought or oversold condition. It therefore confirmed that these strong bull trap events represent false breakouts to the upside.
To avoid false breakouts caused by over-reliance on technical indicators, traders should use a combination of fundamental analysis in combination with technical indicators, such as the moving average and the RSI.
Other Factors
An assortment of other factors can contribute to false breakouts.
For example, stop loss orders are used by traders to limit their losses in case an asset's price moves against them. However, when a large number of traders place stop loss orders at the same price point, it can create a situation where the price of the asset moves below that price point. This can trigger a cascade of stop loss orders, causing a false breakout.
In addition, news releases can have a significant impact on the price of an asset. Traders may interpret the release of positive news as a signal to buy the asset, leading to a perceived breakout. However, if the news is not supported by underlying market trends, the breakout may be false.
Identifying False Breakouts
Analyzing Price and Volume Patterns
When a breakout occurs, look for confirmation from other indicators or patterns before entering a trade. For example, if the asset breaks above a resistance level, traders should look for a high volume to confirm the breakout.
In addition, candlestick patterns are a great tool to help identify false breakouts.
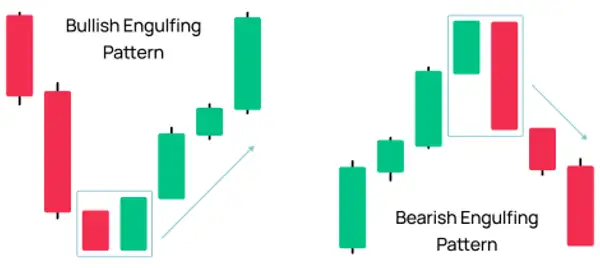
For example, an engulfing pattern is a two-candlestick pattern that occurs when a large candle engulfs a smaller candle of the opposite color. These patterns may either be bullish or bearish and are often seen as reversal signals.
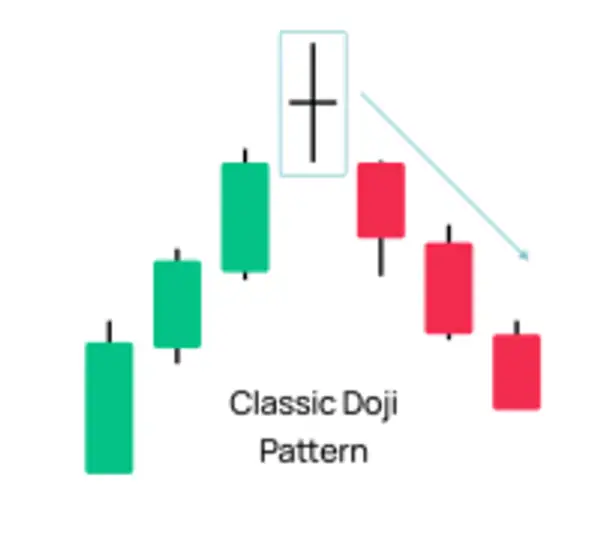
A doji is a candlestick that has a small body and long wicks. This pattern is often seen as a sign of trading indecision and is another useful false breakout identifier.
Three white soldiers represents a bullish reversal pattern comprising a series of long green-bullish candlesticks. As noted in the Bitcoin price action chart provided below, this bullish formation provides a reliable breakout indicator when formed immediately after a downtrend.
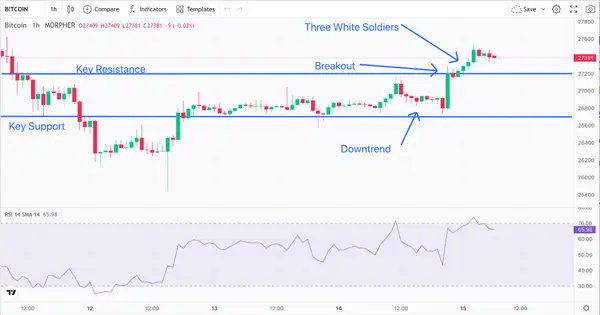
RSI, Resistance, Support, and Breakout Bitcoin 1-Hour Chart (source: Morpher.com)
The RSI can be used to determine if an asset is overbought or oversold, and if the price movement is supported by genuine market trends. If the RSI gives a false signal, it could indicate a false breakout. That is, if the RSI is less than 30, the market is oversold and the price might eventually increase. Conversely, if the RSI is more than 70, the market is overbought, and the price might soon decline. Note that Bitcoin began to decline where the RSI peaked above 70, thereby confirming an overbought condition.
Confirmation Through Multiple Indicators
Traders can use multiple indicators to confirm the false breakouts and make more informed trading decisions.
For example and referring to the Bitcoin chart below, if Bitcoin breaks out of a range (which it did) but fails to sustain the breakout and crosses back below the moving average (which it did), this can confirm a false breakout.
Bollinger Bands, RSI, Resistance, Support, and Breakout Bitcoin 1-Hour Chart (source: Morpher.com)
Bollinger Bands help traders identify overbought or oversold market conditions. If the price breaks out of a range but fails to sustain the breakout and moves back within the Bollinger Bands, it can confirm that the breakout was false.
Adding the Bollinger Bands to our Bitcoin example confirms that the major bull trap was indeed false. This is consistent with the other indicators: the moving average and the RSI.
Strategies for Trading False Breakouts
The “Fade” Strategy
The “fade” strategy involves trading against the initial price movement after a breakout, anticipating that the price will reverse and move back in the opposite direction.
The first step is to identify a false breakout. This false breakout is noted below, where Bitcoin breaks out of a key support level at $27,347 and then quickly pulls back.
The existence of this false breakout is confirmed by the formation of a small body – long wick doji candlestick as well as Bitcoin’s position well below the moving average. A sub-40 RSI further confirms that this is a bullish buying opportunity.
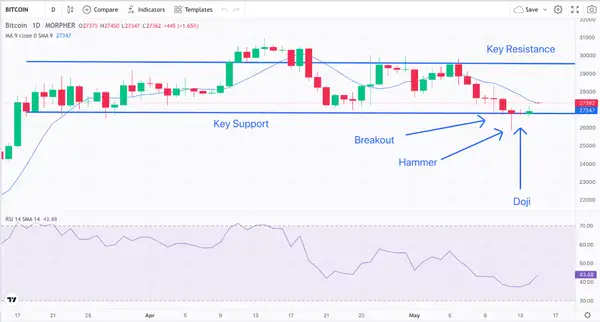
Here, we would enter a position in the opposite direction of the initial price movement. So, since Bitcoin broke out to the downside but quickly reversed, we would enter a long position at $27,347. We would initiate a stop-loss order near the low of the false breakout $26,000 and would establish the moving average price as our exit trade.
By monitoring Bitcoin’s price action, we would adjust the stop-loss order as necessary to protect profits. That is, we would lock in gains as Bitcoin moves toward our exit trade.
The “Reversal” Strategy
The “Reversal” strategy involves trading the reversal after a false breakout occurs.
In this example, the breakout occurs when Bitcoin breaks out of a key resistance level of $27,600 but quickly reverses.
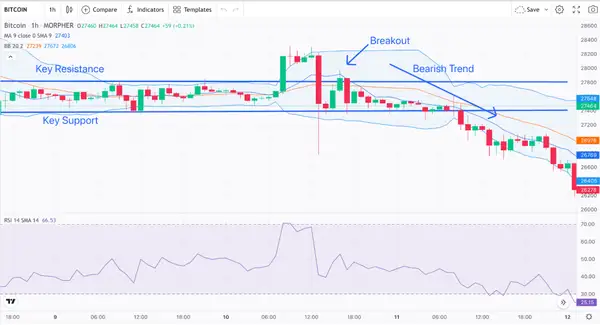
Confirmation of the reversal can be seen from the continuous Bearish trend of negative candlesticks evidencing a change in the trend direction. This trend culminates in a breakout of a key support at $27,400. This presents a strong signal to short Bitcoin.
Having confirmed this reversal, we would enter a short trade at $27,400 and place a stop loss just above this support level. We would set the profit target at a price equivalent to the moving average.
Having entered this trade, we would adjust the stop-loss order as necessary to protect profits.
Conclusion
False breakout trading can be a profitable strategy for experienced traders who are aware of the risks involved. However, it is important to remember that no trading strategy is perfect, and false breakouts can happen even to the most experienced traders. By following the tips in this blog post, you can increase your chances of success when trading false breakouts.

Disclaimer: All investments involve risk, and the past performance of a security, industry, sector, market, financial product, trading strategy, or individual’s trading does not guarantee future results or returns. Investors are fully responsible for any investment decisions they make. Such decisions should be based solely on an evaluation of their financial circumstances, investment objectives, risk tolerance, and liquidity needs. This post does not constitute investment advice.

Painless trading for everyone
Hundreds of markets all in one place - Apple, Bitcoin, Gold, Watches, NFTs, Sneakers and so much more.
Painless trading for everyone
Hundreds of markets all in one place - Apple, Bitcoin, Gold, Watches, NFTs, Sneakers and so much more.