Stock Trend Patterns Revealed

As an experienced stock market analyst and trader, I have spent countless hours studying and analyzing stock trend patterns. These patterns hold the key to unlocking profitable trading opportunities, if you know how to decipher them. In this article, I will guide you through the basics of stock trend patterns, the different types you need to be familiar with, the psychology behind them, and the tools and strategies you can use to identify and trade them effectively.
Understanding the Basics of Stock Trend Patterns
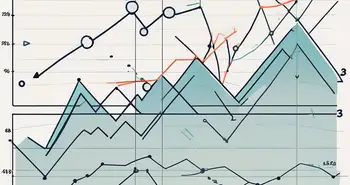
Before diving into the world of stock trend patterns, it's essential to understand what they actually are. Stock trend patterns are repetitive chart formations that occur as a result of supply and demand dynamics in the market. By analyzing these patterns, traders can gain insights into the future direction of a particular stock or market.
Stock trend patterns are not just random occurrences on a chart; they are visual representations of market psychology and investor behavior. These patterns reflect the tug-of-war between buyers and sellers, showcasing moments of indecision, momentum shifts, and potential trend reversals.
Defining Stock Trend Patterns
Stock trend patterns can be broadly categorized into three types: uptrends, downtrends, and sideways/horizontal trends. Each of these patterns has distinct characteristics and implications for traders.
Uptrends are characterized by higher highs and higher lows, indicating a bullish market sentiment. Downtrends, on the other hand, consist of lower highs and lower lows, signaling a bearish trend. Sideways or horizontal trends show a period of consolidation and indecision, with prices moving within a defined range.
The Importance of Recognizing Patterns
Recognizing stock trend patterns is crucial for traders because it allows them to anticipate potential price movements. By identifying patterns, traders can make more informed decisions regarding entry and exit points, as well as risk management strategies.
Moreover, understanding the underlying psychology behind these patterns can provide valuable insights into market sentiment and investor behavior. Traders who can interpret these patterns effectively have a competitive edge in navigating the complexities of the financial markets.
The Different Types of Stock Trend Patterns
Now let's take a closer look at the three major types of stock trend patterns: uptrends, downtrends, and sideways/horizontal trends.
Understanding stock trend patterns is essential for investors and traders to make informed decisions in the financial markets. Let's delve deeper into these patterns to gain a comprehensive insight into how they influence market dynamics and trading strategies.
Uptrends and Downtrends
An uptrend occurs when the price of a stock consistently moves higher over a period of time. This upward trajectory is fueled by optimism among investors, leading to increased buying pressure. Conversely, a downtrend is characterized by a consistent decline in price, driven by negative market sentiment or adverse economic conditions. These trends can last for weeks, months, or even years, shaping the overall market direction.
During uptrends, investors often look for opportunities to buy on pullbacks or price dips, anticipating further price appreciation. In contrast, downtrends prompt traders to consider short-selling strategies or adopting a defensive stance to protect their portfolios from potential losses.
Sideways/Horizontal Trends
A sideways or horizontal trend refers to a situation where the price of a stock moves within a relatively narrow range over an extended period. This consolidation phase typically indicates a temporary equilibrium between buyers and sellers, reflecting market indecision. While sideways trends may lack clear directional bias, they present opportunities for range-bound trading strategies, such as buying at support levels and selling at resistance levels.
Traders navigating sideways trends often employ technical indicators and oscillators to identify potential breakout or breakdown points. These transitional periods can offer valuable insights into market sentiment shifts and impending price volatility. By closely monitoring price action and volume dynamics, traders can position themselves strategically to capitalize on emerging trends.
Reversal Patterns
In addition to the three main trend types, reversal patterns play a crucial role in technical analysis. Reversal patterns indicate a potential change in the prevailing trend, signaling a shift in market dynamics. Recognizable patterns such as head and shoulders or double tops/bottoms serve as early warning signs for traders to adjust their positions accordingly.
Traders often combine reversal patterns with other technical indicators and chart patterns to validate their trading decisions. By incorporating these signals into their analysis, traders can enhance their risk management strategies and optimize their trading performance in evolving market conditions.
The Psychology Behind Stock Trend Patterns
Understanding the psychology behind stock trend patterns is essential for successful trading. Market trends are driven by investor sentiment, which is influenced by factors such as fear and greed.
Investor Sentiment and Market Trends
Investor sentiment refers to the overall attitude and mindset of market participants. When investors are confident and optimistic, it tends to drive prices higher, resulting in uptrends. Conversely, when fear and uncertainty dominate, it can lead to downtrends or sideways trends.
Fear and Greed: Driving Forces of Trends
Fear and greed are two primary emotions that influence investor decision-making. Fear can cause panic selling during market downturns, exacerbating downtrends. On the other hand, greed can lead to irrational buying and price bubbles, driving prices higher before a reversal occurs. Recognizing these emotions and their impact on stock trends is crucial for navigating the market effectively.
Tools for Identifying Stock Trend Patterns
In order to identify stock trend patterns, traders rely on a variety of tools and techniques. Technical analysis plays a significant role in this process.
Technical Analysis for Pattern Recognition
Technical analysis involves studying price charts, using indicators, and analyzing historical patterns to forecast future market movements. Traders utilize tools such as moving averages, trendlines, and oscillators to identify and confirm stock trend patterns.
Utilizing Chart Patterns
Chart patterns, such as head and shoulders, triangles, or flags, provide visual representations of market sentiment and potential trends. These patterns highlight key levels of support and resistance, enabling traders to make informed decisions about entry and exit points.
Strategies for Trading Based on Stock Trend Patterns
Unlocking the secrets of stock trend patterns wouldn't be complete without discussing trading strategies.
Timing Your Entry and Exit
One of the most important aspects of trading based on stock trend patterns is timing your entry and exit points. By patiently waiting for confirmation signals, such as a breakout or reversal pattern, you increase the likelihood of entering trades with favorable risk-to-reward ratios.
Managing Risk with Trend Patterns
Risk management is another crucial element of trading. When dealing with stock trend patterns, it's vital to set stop-loss orders to protect yourself from significant losses if the market moves against your position. Additionally, trailing stops can be employed to lock in profits as trends develop.
Remember, successful trading is not solely reliant on stock trend patterns. It also demands discipline, a solid understanding of fundamental analysis, risk management skills, and continuous education.
As an expert in the field, I've personally witnessed how the mastery of stock trend patterns can lead to profits that exceed expectations. By combining technical analysis, knowledge of investor psychology, and disciplined execution, you can unlock the secrets of stock trend patterns and potentially gain an edge in the market.
FAQ
What are stock trend patterns?
Stock trend patterns are repetitive chart formations resulting from supply and demand dynamics in the market. Analyzing these patterns assists traders in predicting future price movements.
What are the different types of stock trend patterns?
There are three main types of stock trend patterns: uptrends, downtrends, and sideways/horizontal trends. Reversal patterns, which indicate potential trend changes, also play a significant role.
How can I identify stock trend patterns?
Technical analysis and chart patterns are key tools for identifying stock trend patterns. By studying price charts, using indicators, and recognizing visual patterns, traders can spot potential trends.
What is the importance of recognizing stock trend patterns?
Recognizing stock trend patterns enables traders to anticipate future price movements, make informed trading decisions, and manage risk effectively.
How can I trade based on stock trend patterns?
Trading based on stock trend patterns requires timing your entry and exit points strategically and implementing effective risk management strategies, such as setting stop-loss orders and trailing stops.
Now armed with the knowledge of stock trend patterns and their significance, it's time to apply what you've learned and start uncovering the secrets of the stock market.
Ready to put your newfound knowledge of stock trend patterns into action? Look no further than Morpher, the revolutionary trading platform that's changing the game with blockchain technology. With Morpher, you can trade a wide array of assets with zero fees, infinite liquidity, and the option for fractional investing. Whether you're looking to capitalize on uptrends, navigate downtrends, or explore sideways markets, Morpher's unique trading experience has you covered. Plus, with up to 10x leverage and the safety of a non-custodial wallet, you're in full control. Sign Up and Get Your Free Sign Up Bonus today to start trading the smart way!

Disclaimer: All investments involve risk, and the past performance of a security, industry, sector, market, financial product, trading strategy, or individual’s trading does not guarantee future results or returns. Investors are fully responsible for any investment decisions they make. Such decisions should be based solely on an evaluation of their financial circumstances, investment objectives, risk tolerance, and liquidity needs. This post does not constitute investment advice.

Painless trading for everyone
Hundreds of markets all in one place - Apple, Bitcoin, Gold, Watches, NFTs, Sneakers and so much more.

Painless trading for everyone
Hundreds of markets all in one place - Apple, Bitcoin, Gold, Watches, NFTs, Sneakers and so much more.


