Weekly Candlestick Chronicles: ETH/USD Analysis (May 1 – May 17, 2024)
by Esin Syonmez
Share:


Welcome to this week's edition of Candlestick Chronicles, where we uncover the hidden stories told by candlestick patterns on different asset charts. In the volatile world of cryptocurrency trading, understanding these patterns can be the key to unlocking market movements.
Candlestick patterns are powerful tools that provide insights into market sentiment, potential reversals, and continuations. By mastering these patterns, traders can make more informed decisions, anticipate market trends, and improve their trading strategies. This week, we're focusing on the ETH/USD chart from May 1 to May 17, 2024. Let's dive in and discover what the candles are telling us.
Ethereum (ETH) Overview
Ethereum is a decentralized, open-source blockchain system that features smart contract functionality. It was proposed in late 2013 by programmer Vitalik Buterin and development began through a Swiss company, Ethereum Switzerland GmbH (EthSuisse), with the system going live on July 30, 2015.
Key Features of Ethereum
Smart Contracts: Ethereum introduced the concept of smart contracts, which are self-executing contracts with the terms of the agreement directly written into code. These contracts automatically enforce and execute the terms of a contract when predefined conditions are met.
Decentralized Applications (DApps): Ethereum provides a platform for developers to build decentralized applications (DApps) that run on the blockchain, offering increased security and reduced downtime compared to traditional applications.
Ethereum Virtual Machine (EVM): The EVM is the runtime environment for smart contracts on Ethereum. It allows developers to create applications that can interact with the Ethereum blockchain in a secure and decentralized manner.
ETH 2.0 and Proof of Stake (PoS): Ethereum is transitioning from a Proof of Work (PoW) consensus mechanism to a Proof of Stake (PoS) mechanism with Ethereum 2.0. This upgrade aims to improve the scalability, security, and sustainability of the network.
Recent Market Performance
In recent years, Ethereum has seen significant growth, driven by the increasing adoption of DeFi applications and the rise of NFTs. As of May 2024, Ethereum continues to be a leading cryptocurrency, second only to Bitcoin in terms of market capitalization. Its versatile platform and robust developer community make it a cornerstone of the blockchain ecosystem.
Discover Morpher's innovative approach to trading by leveraging Ethereum. Morpher revolutionizes the trading experience by replacing intermediaries such as brokers, exchanges, and counterparties to a trade with an incorruptible protocol on the Ethereum blockchain. Sign up for Morpher now and capitalize on this groundbreaking technology to enhance your trading strategy!
Candlestick Pattern Analysis for ETH/USD (May 1 – May 17, 2024)
2-4 May: Three Inside Up – Bullish Reversal
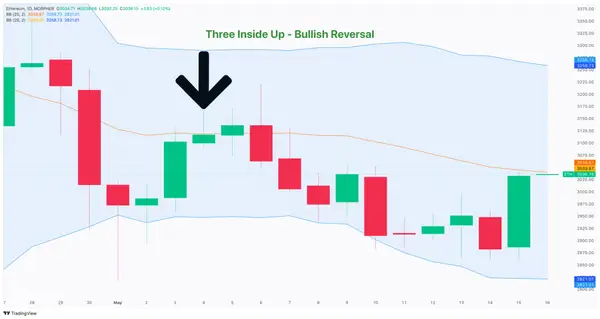
May 2, 2024: A small green candlestick within the body of the preceding larger red candlestick.
May 3, 2024: Another green candlestick that closes higher than the previous day's close.
May 4, 2024: A larger green candlestick that closes above the high of the first red candlestick in the pattern.
Analysis:
Pattern Significance: The Three Inside Up pattern is a bullish reversal pattern. It indicates that the downtrend may be coming to an end and that buyers are starting to gain control.
Market Implication: The presence of this pattern suggests a potential reversal from a downtrend to an uptrend. Traders may see this as a signal to consider entering long positions, anticipating further upward movement.
6 May: Engulfing Bearish – Bearish Reversal
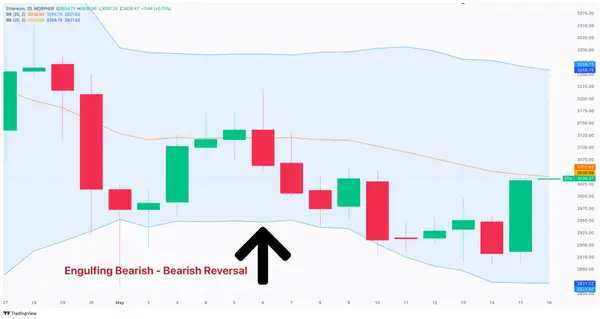
May 6, 2024: A large red candlestick that completely engulfs the body of the preceding small green candlestick.
Analysis:
Pattern Significance: The Engulfing Bearish pattern is a strong bearish reversal signal. It indicates that sellers have taken control, overpowering the previous bullish sentiment.
Market Implication: This pattern suggests a potential reversal from an uptrend to a downtrend. Traders might consider this a signal to exit long positions or enter short positions, expecting further downward movement.
11 May: Doji Star – Bullish Reversal
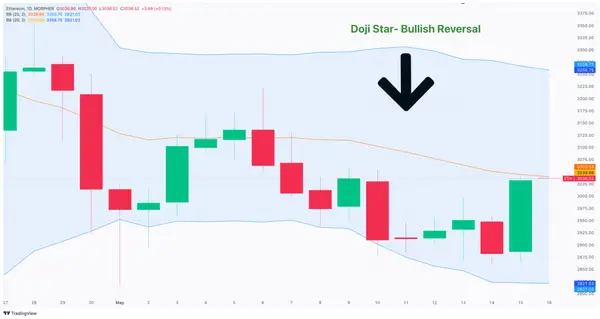
May 11, 2024: A doji candlestick (open and close prices are nearly equal) following a series of red candlesticks, creating the appearance of a star.
Analysis:
Pattern Significance: The Doji Star pattern is a bullish reversal pattern that indicates market indecision. After a downtrend, the appearance of a doji suggests that selling pressure may be weakening.
Market Implication: This pattern suggests a potential bullish reversal. Traders might see this as a signal to watch for confirmation of the reversal, such as a subsequent bullish candlestick, before entering long positions.
10-14 May: Falling Three Methods – Bearish Continuation
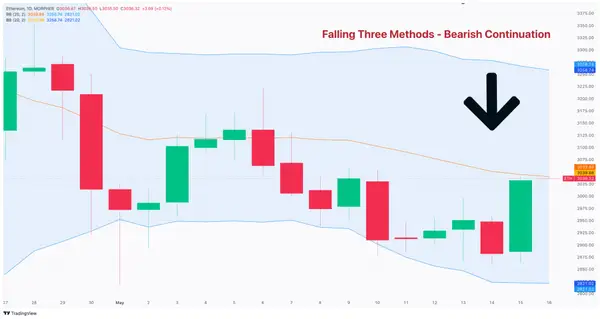
May 10, 2024: A long red candlestick.
May 12-13, 2024: Two or more small green candlesticks that stay within the range of the first red candlestick.
May 14, 2024: Another long red candlestick that closes below the first red candlestick's close.
Analysis:
Pattern Significance: The Falling Three Methods pattern is a bearish continuation pattern. It indicates that the current downtrend will likely continue after a brief consolidation period.
Market Implication: This pattern suggests a continuation of the existing downtrend. Traders may interpret this as a signal to maintain or enter short positions, expecting further downward movement.
Strengthening Your Analysis with Complementary Indicators
While candlestick patterns provide valuable insights into market sentiment and potential price movements, combining them with other technical indicators can enhance the accuracy and reliability of your trading decisions. Here are a few indicators to consider:
Volume
Analyzing the volume accompanying candlestick patterns can confirm the strength of the signal. Higher volume during the formation of a pattern typically validates the pattern, indicating stronger buying or selling pressure.
Moving Averages
Moving averages, such as the 50-day and 200-day moving averages, help identify the overall trend direction and potential support and resistance levels. Combining moving averages with candlestick patterns can provide a clearer picture of the market trend.
Relative Strength Index (RSI)
The RSI is a momentum oscillator that measures the speed and change of price movements. It helps determine if an asset is overbought or oversold. When combined with candlestick patterns, the RSI can provide additional context to identify potential reversals or continuations.
Bollinger Bands
Bollinger Bands consist of a moving average and two standard deviation lines. They indicate volatility and potential price reversals. Candlestick patterns near the outer bands can signal potential market turning points.
Conclusion
The ETH/USD chart from May 1 to May 17, 2024, showcased several key candlestick patterns that provided insights into potential market reversals and continuations. By analyzing the Three Inside Up, Engulfing Bearish, Doji Star, and Falling Three Methods patterns, traders can better understand market sentiment and anticipate future price movements.
2-4 May: Three Inside Up: A bullish reversal pattern indicating a potential shift from downtrend to uptrend.
6 May: Engulfing Bearish: A bearish reversal pattern indicating a potential shift from uptrend to downtrend.
11 May: Doji Star: A bullish reversal pattern suggesting market indecision and potential shift to upward movement.
11-14 May: Falling Three Methods: A bearish continuation pattern indicating that the downtrend is likely to continue after a brief consolidation.
Combining these candlestick patterns with other technical indicators such as volume, moving averages, RSI, and Bollinger Bands can enhance your trading strategy and decision-making process. This multi-faceted approach helps ensure a more comprehensive and reliable analysis.
Discover the power of combining candlestick patterns with technical indicators on Morpher. Customize your charts and apply your analysis using advanced tools designed to enhance your trading skills. With over 50 popular technical indicators available, you can strengthen your strategy by integrating them with candlestick patterns. Sign up for Morpher now and take advantage of the sign-up bonus to start practicing today!
Stay tuned for next week's Candlestick Chronicles, where we'll continue to explore and decode the fascinating world of candlestick patterns across various asset charts. Happy trading!

Disclaimer: All investments involve risk, and the past performance of a security, industry, sector, market, financial product, trading strategy, or individual’s trading does not guarantee future results or returns. Investors are fully responsible for any investment decisions they make. Such decisions should be based solely on an evaluation of their financial circumstances, investment objectives, risk tolerance, and liquidity needs. This post does not constitute investment advice.

Painless trading for everyone
Hundreds of markets all in one place - Apple, Bitcoin, Gold, Watches, NFTs, Sneakers and so much more.
Painless trading for everyone
Hundreds of markets all in one place - Apple, Bitcoin, Gold, Watches, NFTs, Sneakers and so much more.