
As a seasoned trader, one of the most valuable tools in my arsenal is the Standard Deviation Indicator. This powerful indicator not only helps me understand market volatility but also allows me to make informed trading decisions. In this comprehensive guide, I will take you through everything you need to know about using the Standard Deviation Indicator to enhance your trading strategies.
Understanding the Standard Deviation Indicator
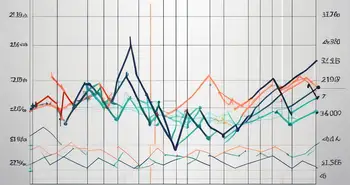
Before diving into the nitty-gritty of the Standard Deviation Indicator, let's first understand what it actually is. In simple terms, it measures the price volatility of a financial instrument over a given period of time. By analyzing price movements, the Standard Deviation Indicator helps us gauge how much a price deviates from its average value. This information is crucial for identifying potential trading opportunities.
When traders utilize the Standard Deviation Indicator, they are essentially looking at how spread out the prices are from the average. This statistical tool provides a numerical value to represent this spread, giving traders a quantifiable measure of market volatility. By having a clear understanding of the level of volatility in the market, traders can make informed decisions on when to enter or exit trades.
What is the Standard Deviation Indicator?
The Standard Deviation Indicator is a statistical calculation that determines the dispersion of prices around the mean value. It quantifies the degree of price variability, allowing traders to assess the level of risk involved in a particular asset. A higher standard deviation suggests greater price volatility, while a lower standard deviation indicates relative stability.
Traders often use the Standard Deviation Indicator in conjunction with other technical analysis tools to confirm trading signals. By incorporating this indicator into their analysis, traders can gain a more comprehensive view of market conditions and make more strategic decisions. Understanding how to interpret the Standard Deviation Indicator can give traders an edge in predicting potential price movements.
Importance of the Standard Deviation Indicator in Trading
The Standard Deviation Indicator holds immense significance in trading due to its ability to measure market volatility. By understanding the volatility, traders can identify periods of high or low price fluctuations, enabling them to adjust their trading strategies accordingly. This valuable information helps traders make well-informed decisions and manage their risk effectively.
Moreover, the Standard Deviation Indicator can also be used to assess the reliability of other technical indicators. Traders can compare the standard deviation values with the signals generated by other indicators to validate the strength of a trading signal. This cross-referencing technique adds another layer of confirmation to trading decisions, enhancing the overall effectiveness of a trader's strategy.
Setting Up the Standard Deviation Indicator
Now that we have a solid understanding of what the Standard Deviation Indicator is, let's discuss how to set it up to start using it in your trading approach.
The Standard Deviation Indicator is a powerful tool in technical analysis that helps traders measure the volatility of a financial instrument. By understanding how much an asset's price deviates from its average price, traders can make more informed decisions about when to enter or exit trades.
Choosing the Right Trading Platform
First and foremost, it's crucial to choose a trading platform that provides access to the Standard Deviation Indicator. Not all platforms have this indicator, so make sure to select one that offers a comprehensive set of technical analysis tools.
When selecting a trading platform, consider factors such as user-friendliness, reliability, and the availability of other technical indicators that complement the Standard Deviation Indicator. A platform with a customizable interface and real-time data can enhance your trading experience and help you make better-informed decisions.
Configuring the Standard Deviation Indicator Settings
Once you have the appropriate trading platform, it's time to configure the settings of the Standard Deviation Indicator. Depending on the platform, you can adjust parameters such as the time period and the number of standard deviations. These settings can be customized based on your trading preferences and the specific market you are analyzing.
Experimenting with different settings and observing how the indicator reacts to historical price data can help you gain a deeper understanding of its functionality. By fine-tuning the Standard Deviation Indicator to suit your trading style, you can leverage its insights to identify potential trading opportunities and manage risk effectively.
Interpreting the Standard Deviation Indicator
Now that you have set up the Standard Deviation Indicator, it's essential to understand how to interpret its signals effectively.
Understanding the Standard Deviation Indicator is crucial for successful trading in the financial markets. This technical analysis tool measures the dispersion of price data from its average value, providing valuable insights into market volatility and potential trend reversals.
Reading the Standard Deviation Indicator
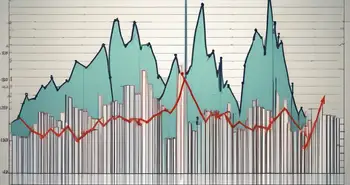
When analyzing the Standard Deviation Indicator, keep an eye out for periods of high volatility. If the indicator value is high, it indicates that prices have a wider range of fluctuations, suggesting increased market uncertainty. Conversely, a low indicator value suggests a period of stability and relatively predictable price movements.
It is important to note that interpreting the Standard Deviation Indicator should not be done in isolation. Traders often combine this tool with other technical indicators or chart patterns to confirm trading signals and make well-informed decisions.
Understanding Volatility with the Standard Deviation Indicator
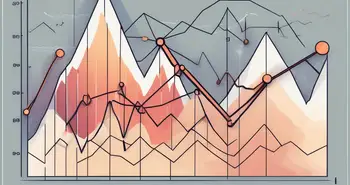
The Standard Deviation Indicator not only helps us identify volatility levels but also gives insights into potential market reversals. When the indicator's value reaches extreme levels, it may suggest an overbought or oversold condition, indicating a possible trend reversal. This information can be used to anticipate market movements and adjust your trading strategy accordingly.
Moreover, traders can use the Standard Deviation Indicator to set stop-loss levels and determine optimal entry and exit points. By incorporating risk management techniques with the insights provided by this indicator, traders can enhance their overall trading performance and minimize potential losses.
Strategies for Using the Standard Deviation Indicator
Now that you understand how to interpret the Standard Deviation Indicator, let's explore some effective strategies for integrating it into your trading approach.
When delving deeper into the realm of technical analysis, it becomes evident that the Standard Deviation Indicator, with its ability to measure market volatility, plays a crucial role in identifying potential trading opportunities. By understanding the fluctuations in price movements indicated by the standard deviation, traders can make informed decisions based on the level of risk they are willing to undertake.
Combining the Standard Deviation Indicator with Other Indicators
While the Standard Deviation Indicator is powerful on its own, it can be even more effective when combined with other technical analysis indicators. By using multiple indicators that complement each other, you can confirm signals and improve the accuracy of your trading decisions.
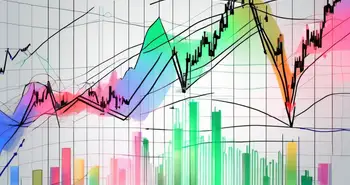
For instance, pairing the Standard Deviation Indicator with a moving average can provide a comprehensive view of both volatility and trend direction. This combined approach can help traders identify potential trend reversals or continuations with greater confidence, leading to more profitable trading outcomes.
Timing Trades with the Standard Deviation Indicator
Another valuable strategy is to use the Standard Deviation Indicator to determine the opportune timing for entering or exiting trades. By analyzing the indicator's values in conjunction with other market factors, such as support and resistance levels, you can optimize your entry and exit points and maximize your potential profits.
Moreover, incorporating fundamental analysis alongside the Standard Deviation Indicator can offer a well-rounded perspective on market conditions. By considering economic indicators, news events, and geopolitical developments in conjunction with standard deviation data, traders can make more informed decisions that take into account both technical and fundamental aspects of the market.
Common Mistakes to Avoid When Using the Standard Deviation Indicator
While the Standard Deviation Indicator is an invaluable tool, it's important to steer clear of common mistakes that traders often make.
Understanding the nuances of the Standard Deviation Indicator can significantly enhance your trading decisions. One additional mistake to avoid is neglecting to adjust the indicator's settings to suit different market conditions. By customizing the parameters such as the time period or standard deviation multiplier, traders can adapt to varying levels of volatility and better capture meaningful price movements.
Overreliance on the Standard Deviation Indicator
One common pitfall is relying too heavily on the Standard Deviation Indicator alone. Remember that no single indicator can guarantee accurate predictions. It's crucial to combine the insights from the indicator with other technical and fundamental analysis factors to make well-rounded trading decisions.
Misinterpreting the Standard Deviation Indicator Signals
It's easy to misinterpret the signals provided by the Standard Deviation Indicator. A high indicator value doesn't necessarily mean the market will reverse immediately, nor does a low value guarantee stable conditions. Always consider multiple factors and analyze the broader market context before making trading decisions.
Expanding your knowledge beyond just the Standard Deviation Indicator can lead to more informed trading strategies. For instance, incorporating trend analysis or volume indicators alongside the Standard Deviation Indicator can provide a comprehensive view of market dynamics. By diversifying your analytical toolkit, you can gain a competitive edge in navigating complex market environments.
Now that you are equipped with a comprehensive understanding of the Standard Deviation Indicator, it's time to put your knowledge into practice. Remember to approach trading with a disciplined mindset, continually educate yourself, and be prepared to adapt your strategies as market conditions evolve. Happy trading!
Ready to take your trading to the next level with the insights from the Standard Deviation Indicator? Join Morpher, the revolutionary trading platform that leverages blockchain technology to offer zero fees, infinite liquidity, and a unique trading experience. With Morpher, you can trade across a multitude of asset classes, enjoy the benefits of fractional investing, and even engage in short selling without interest fees. Plus, with up to 10x leverage and the safety of a non-custodial wallet, you're in full control of your trading journey. Sign Up and Get Your Free Sign Up Bonus today to transform the way you invest with Morpher!

Disclaimer: All investments involve risk, and the past performance of a security, industry, sector, market, financial product, trading strategy, or individual’s trading does not guarantee future results or returns. Investors are fully responsible for any investment decisions they make. Such decisions should be based solely on an evaluation of their financial circumstances, investment objectives, risk tolerance, and liquidity needs. This post does not constitute investment advice.

Painless trading for everyone
Hundreds of markets all in one place - Apple, Bitcoin, Gold, Watches, NFTs, Sneakers and so much more.
Painless trading for everyone
Hundreds of markets all in one place - Apple, Bitcoin, Gold, Watches, NFTs, Sneakers and so much more.