In this ultimate guide, I will provide you with a comprehensive overview of the Accumulation Distribution Indicator and how it can enhance your trading skills. Whether you are a seasoned trader or just starting out, understanding and effectively using this indicator can greatly improve your decision-making process in the market.
Understanding the Accumulation Distribution Indicator
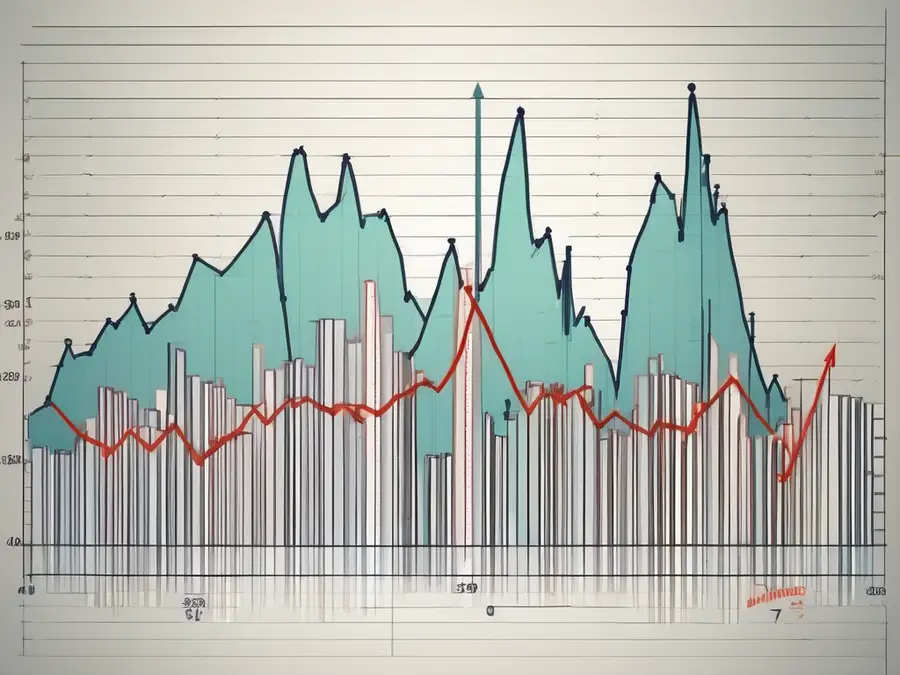
First, let's dive into what the Accumulation Distribution Indicator actually is. In simple terms, it is a volume-based indicator that helps traders identify potential buying and selling pressure in a particular security. By analyzing the relationship between volume and price, this indicator provides valuable insights into market trends and potential reversals.
So why is the Accumulation Distribution Indicator important in trading? Well, it helps us gauge the strength of price movements and identify possible trading opportunities. It combines both volume and price action, giving us a holistic view of market sentiment.
When using the Accumulation Distribution Indicator, traders look for divergence between the indicator and the price of the security. Divergence can signal potential shifts in market sentiment, indicating a possible trend reversal. This is a key aspect that traders pay close attention to when making trading decisions based on this indicator.
Furthermore, the Accumulation Distribution Indicator is also used to confirm the strength of a current trend. If the indicator is moving in the same direction as the price, it suggests that the trend is likely to continue. On the other hand, if the indicator is moving in the opposite direction of the price, it could indicate a weakening trend and potential reversal.
The Mechanics of the Accumulation Distribution Indicator
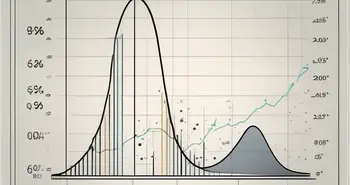
Now that we have a solid understanding of what this indicator is and why it is important, let's take a closer look at how it actually works. The Accumulation Distribution Indicator is calculated using two main components: the volume and the close price of each trading period.
By analyzing the relationship between volume and price, the Accumulation Distribution Indicator produces a line graph that reflects the buying and selling pressure within a particular security. This line, known as the Accumulation Distribution Line, can provide traders with valuable insights into market trends and potential reversals.
One interesting aspect of the Accumulation Distribution Indicator is that it takes into account not just the price movement of a security, but also the volume at which that price movement occurs. This means that the indicator can help traders identify whether a price movement is backed by strong buying or selling pressure, giving them a more comprehensive view of market sentiment.
Furthermore, the Accumulation Distribution Line can be used in conjunction with other technical analysis tools to confirm potential trade signals. For example, if a security's price is breaking out to new highs, traders may look for confirmation from the Accumulation Distribution Line showing a corresponding increase in buying pressure to validate the strength of the breakout.
Interpreting the Accumulation Distribution Line
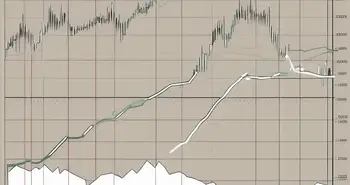
When analyzing the Accumulation Distribution Line, there are a few key things to keep in mind. First, pay attention to the direction of the line. If the line is trending upwards, it suggests that buying pressure is increasing and vice versa.
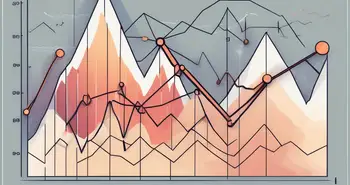
Secondly, look for divergences between the price action and the Accumulation Distribution Line. Divergences can indicate potential reversals in the market. For example, if the price is making higher highs while the Accumulation Distribution Line is making lower highs, it could be a sign of weakening buying pressure and a possible future downtrend.
Traders also often use moving averages in conjunction with the Accumulation Distribution Line to smooth out the data and identify longer-term trends. By applying a moving average to the Accumulation Distribution Line, traders can better visualize the overall trend in buying and selling pressure, helping them make more informed trading decisions.
Using the Accumulation Distribution Indicator Effectively
Now that we understand how the Accumulation Distribution Indicator works, let's explore some strategies for using it effectively in our trading.
Strategies for Using the Accumulation Distribution Indicator
One effective strategy is to look for divergences between the price action and the Accumulation Distribution Line. As mentioned earlier, divergences can signal potential reversals in the market. By identifying these divergences, we can anticipate changes in market sentiment and make informed trading decisions.
Another strategy is to use the Accumulation Distribution Indicator in conjunction with other technical indicators. By combining different indicators, we can confirm trading signals and increase our overall probability of success.
Common Mistakes to Avoid When Using the Accumulation Distribution Indicator
While the Accumulation Distribution Indicator can be a powerful tool, it's essential to avoid common mistakes that can lead to poor trading decisions. One common mistake is relying solely on this indicator without considering other important factors such as market news, economic data, and overall market trends. It's crucial to use the Accumulation Distribution Indicator as part of a well-rounded trading strategy rather than relying on it alone.
Another mistake is overcomplicating the analysis. It's important to keep things simple and stick to the basic principles of the indicator. Overanalyzing can lead to confusion and potentially missed opportunities.
The Accumulation Distribution Indicator vs Other Trading Indicators
Now, let's compare the Accumulation Distribution Indicator to other commonly used trading indicators.
Key Differences Between the Accumulation Distribution Indicator and Other Indicators
Unlike some other indicators that solely focus on price action or volume, the Accumulation Distribution Indicator combines both these elements. This unique characteristic gives us a more comprehensive view of market sentiment and potential trends.
Additionally, the Accumulation Distribution Indicator is particularly effective in identifying potential reversals and divergences. Its ability to analyze buying and selling pressure provides valuable insights into market dynamics.
Choosing the Right Indicator for Your Trading Style
Ultimately, the choice of trading indicator depends on your individual trading style and preferences. While the Accumulation Distribution Indicator offers valuable insights, it's important to consider other indicators that align with your trading approach. Experimentation and continuous learning are key to finding the right mix of indicators that work best for you.
Enhancing Your Trading Skills with the Accumulation Distribution Indicator
Now that we have covered the fundamentals of the Accumulation Distribution Indicator, let's explore some tips for maximizing its use and integrating it into a balanced trading strategy.
Tips for Maximizing the Use of the Accumulation Distribution Indicator
First and foremost, practice, practice, practice. Familiarize yourself with the indicator by studying historical charts and identifying patterns. The more you use the indicator, the better you will become at interpreting its signals accurately.
Secondly, consider using the Accumulation Distribution Indicator in combination with other technical analysis tools such as trend lines, support and resistance levels, and moving averages. By combining multiple indicators, you can strengthen your overall trading strategy and improve your decision-making process.
Lastly, always remember to set stop-loss orders to protect yourself from potential losses. No indicator is foolproof, and it's crucial to have a risk management plan in place to safeguard your capital.
The Role of the Accumulation Distribution Indicator in a Balanced Trading Strategy
When used in conjunction with other technical analysis tools and fundamental analysis, the Accumulation Distribution Indicator can significantly enhance your trading strategy. By incorporating this indicator into a balanced approach, you can make more informed trading decisions and increase your overall success rate. Remember, a well-rounded trading strategy considers multiple factors and indicators to gain a holistic view of the market.
FAQ
What is the Accumulation Distribution Indicator?
The Accumulation Distribution Indicator is a volume-based indicator that helps traders identify potential buying and selling pressure within a security.
How does the Accumulation Distribution Indicator work?
The Accumulation Distribution Indicator combines volume and price action to produce an Accumulation Distribution Line that reflects market sentiment and potential reversals.
What are some strategies for using the Accumulation Distribution Indicator?
Some strategies include looking for divergences between the price action and the Accumulation Distribution Line, as well as using it in combination with other technical indicators.
What mistakes should I avoid when using the Accumulation Distribution Indicator?
Avoid relying solely on this indicator and failing to consider other important factors. Also, avoid overcomplicating the analysis and sticking to the basic principles of the indicator.
How does the Accumulation Distribution Indicator compare to other trading indicators?
The Accumulation Distribution Indicator stands out by combining volume and price action analysis, making it effective in identifying potential reversals and divergences.
How can I enhance my trading skills with the Accumulation Distribution Indicator?
Maximize the use of the indicator by practicing, combining it with other technical analysis tools, and implementing a risk management plan.
There you have it – the ultimate guide to the Accumulation Distribution Indicator. By understanding its mechanics, using it effectively, and incorporating it into a balanced trading strategy, you can take your trading skills to the next level. Remember, continuous learning, practice, and disciplined risk management are key elements to success in the dynamic world of trading.
Ready to elevate your trading with the insights from the Accumulation Distribution Indicator? Join Morpher, the revolutionary trading platform that integrates the power of blockchain technology for a seamless, zero-fee trading experience. With Morpher, you can trade a diverse range of assets, from stocks and cryptocurrencies to unique markets like NFTs and sneakers, all with fractional investing and up to 10x leverage. Experience the future of trading with infinite liquidity and take control of your investments with the secure, non-custodial Morpher Wallet. Sign Up and Get Your Free Sign Up Bonus today, and start trading on a platform that's as innovative as your strategies.
Disclaimer: All investments involve risk, and the past performance of a security, industry, sector, market, financial product, trading strategy, or individual’s trading does not guarantee future results or returns. Investors are fully responsible for any investment decisions they make. Such decisions should be based solely on an evaluation of their financial circumstances, investment objectives, risk tolerance, and liquidity needs. This post does not constitute investment advice.
Painless trading for everyone
Hundreds of markets all in one place - Apple, Bitcoin, Gold, Watches, NFTs, Sneakers and so much more.
Painless trading for everyone
Hundreds of markets all in one place - Apple, Bitcoin, Gold, Watches, NFTs, Sneakers and so much more.
Subscribe now to our newsletter to get critical insights and analysis: