
In the world of Forex trading, understanding graph patterns is a crucial aspect of success. Knowing how to interpret and analyze these patterns can provide valuable insights into market trends and potential trading opportunities. In this comprehensive guide, I will take you through the basics of Forex trading, the importance of graph patterns, and the various types of patterns you can encounter. We will also delve into how to read and interpret these patterns, using tools such as support and resistance levels, trend lines, and breakouts. Let's get started!
Understanding Forex Trading
Before we dive into the exciting world of Forex graph patterns, let's first establish a solid understanding of Forex trading itself. Forex, short for foreign exchange, is the global marketplace for exchanging currencies. Traders in this market aim to profit from the fluctuations in currency exchange rates by buying low and selling high.
The Basics of Forex Trading
Forex trading involves the buying and selling of currency pairs, such as EUR/USD or GBP/JPY. Each currency pair has a base currency and a quote currency, and the exchange rate reflects the value of the quote currency in terms of the base currency. The foreign exchange market operates 24 hours a day, five days a week, making it a highly liquid and accessible market for traders around the world.
One of the unique features of Forex trading is the use of leverage, which allows traders to control larger positions with a smaller amount of capital. However, it's important to understand that leverage can amplify both profits and losses, so it should be used with caution.
Importance of Forex Graph Patterns in Trading
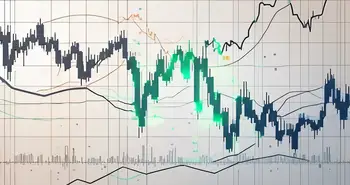
Forex graph patterns are visual representations of price movements on a chart. By analyzing these patterns, traders can gain insights into market sentiment and potential future price movements. Graph patterns can help identify trends, reversals, and continuation patterns, allowing traders to make more informed trading decisions.
Understanding different types of graph patterns, such as head and shoulders, triangles, flags, and pennants, can provide valuable information for traders. For example, a head and shoulders pattern typically indicates a reversal in the market trend, while a triangle pattern suggests a period of consolidation before a potential breakout. Recognizing these patterns can help traders anticipate market movements and adjust their strategies accordingly.
Moreover, combining technical analysis with Forex graph patterns can enhance trading decisions. Technical indicators like moving averages, RSI, and MACD can complement the insights gained from graph patterns, providing a more comprehensive view of the market. By utilizing a combination of tools and strategies, traders can improve their chances of success in the dynamic and competitive world of Forex trading.
Types of Forex Graph Patterns
There are several types of Forex graph patterns that traders commonly encounter. Let's explore each of these patterns, their characteristics, and how they can be identified.
Understanding different types of graph patterns in Forex trading can provide valuable insights into market trends and potential opportunities for traders. By recognizing these patterns, traders can make more informed decisions and improve their chances of success in the dynamic world of foreign exchange.
Reversal Patterns
Reversal patterns indicate a potential change in the direction of a trend. These patterns are formed when the price movement reverses its previous direction, signaling a shift in market sentiment. Traders often look for these patterns to anticipate trend reversals and capitalize on new market directions. Examples of reversal patterns include head and shoulders, double tops, and double bottoms.
Head and shoulders patterns, for instance, consist of three peaks – the middle peak being the highest (the head), flanked by two lower peaks (the shoulders). This pattern suggests a trend reversal from bullish to bearish or vice versa, depending on its orientation within the price chart.
Continuation Patterns
Continuation patterns suggest that the price is likely to continue its current trend after a period of consolidation. These patterns typically indicate a brief pause in the market before the trend resumes. Traders use these patterns to confirm the strength of an existing trend and potentially enter trades in the direction of that trend. Examples of continuation patterns include triangles, flags, and rectangles.
Triangles, one of the most common continuation patterns, are formed by converging trend lines that represent a period of consolidation before the price breaks out in the direction of the prevailing trend. Traders often wait for a clear breakout from the triangle pattern to confirm the continuation of the trend.
Bilateral Patterns
Bilateral patterns, also known as symmetrical patterns, are characterized by converging trend lines. These patterns indicate a period of indecision in the market, with buyers and sellers in equilibrium. Traders interpret these patterns as a potential precursor to a significant price movement, as the market participants decide on the next direction. Examples of bilateral patterns include pennants and wedges, which can provide valuable insights into potential breakout opportunities.
Wedges, for example, are characterized by converging trend lines that move in the same direction, either upward or downward. This pattern signifies a tightening range of price movement, indicating a potential breakout in the near future. Traders often monitor wedges closely for signs of a breakout, as it can lead to significant trading opportunities.
Reading Forex Graph Patterns
Now that we have learned about the different types of Forex graph patterns, let's explore how to read and interpret these patterns to make informed trading decisions.
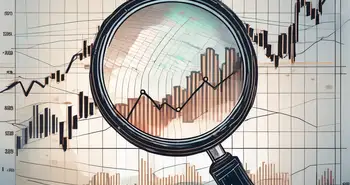
Identifying Support and Resistance Levels
Support and resistance levels are key areas on a chart where the price tends to stall or reverse. These levels are formed by previous price action and can act as barriers for future price movements. By identifying support and resistance levels, traders can anticipate potential price reversals or breakouts.
Recognizing Trend Lines
Trend lines are diagonal lines drawn on a chart to connect consecutive highs or lows. They help traders visualize the direction of a trend and identify potential areas of support or resistance. By following trend lines, traders can align their trades with the prevailing market trend.
Spotting Breakouts and Breakdowns
Breakouts and breakdowns occur when the price breaks above a resistance level or below a support level, respectively. These price movements can indicate a significant shift in market sentiment and often lead to strong trends. By spotting breakouts and breakdowns, traders can enter trades at the early stages of a new trend for maximum profit potential.
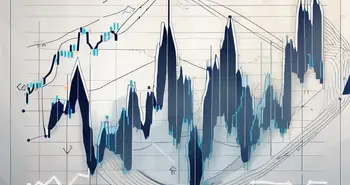
Interpreting Forex Graph Patterns
Now that we have covered how to read Forex graph patterns, let's explore various tools and indicators that can aid in interpreting these patterns.
Volume Analysis in Pattern Interpretation
Volume analysis is an important component of pattern interpretation. By analyzing the trading volume accompanying a pattern, traders can gauge the strength of market participation and validate the reliability of the pattern. High volume during a breakout, for example, suggests strong buying or selling pressure, increasing the likelihood of a sustained trend.
Using Moving Averages for Interpretation
Moving averages are commonly used to smooth out price data and identify the overall trend. By plotting different periods of moving averages on a chart, traders can receive signals for potential trend reversals or continuations. Moving averages can confirm the presence of a trend and provide entry and exit signals.
Role of Oscillators in Pattern Interpretation
Oscillators, such as the Relative Strength Index (RSI) or the Stochastic Oscillator, help traders identify overbought or oversold conditions in the market. When the price reaches extreme levels indicated by these oscillators, it suggests a potential reversal or continuation of the trend. Oscillators can be used in conjunction with graph patterns to confirm trading signals.
With a solid understanding of how to read and interpret Forex graph patterns, you are well-equipped to make informed trading decisions in the dynamic world of Forex trading. Remember, practice and patience are key. Develop a trading plan, stick to your strategy, and always consider the risk involved. Happy trading!
FAQ
1. Why are Forex graph patterns important?
Forex graph patterns provide valuable insights into market trends and potential trading opportunities. By analyzing these patterns, traders can make informed decisions about the direction of price movements.
2. What are the different types of Forex graph patterns?
The different types of Forex graph patterns include reversal patterns, continuation patterns, and bilateral patterns.
3. How can I identify support and resistance levels on a chart?
Support and resistance levels can be identified by looking for areas where the price has previously stalled or reversed. These levels act as barriers for future price movements.
4. What is the significance of breakouts and breakdowns?
Breakouts and breakdowns indicate a significant shift in market sentiment and often lead to strong trends. Traders can enter trades at the early stages of these movements for maximum profit potential.
5. How can I validate the reliability of a pattern?
Volume analysis can help validate the reliability of a pattern. High volume during a breakout, for example, suggests strong buying or selling pressure, increasing the likelihood of a sustained trend.
As an expert Forex trader, I have seen firsthand the power of graph patterns in predicting market movements. By mastering the art of reading and interpreting these patterns, you will gain a valuable edge in your trading journey. Remember, practice makes perfect, so take the time to familiarize yourself with different patterns and develop a trading strategy that suits your trading style. Good luck and happy trading!
Ready to put your newfound knowledge of Forex graph patterns into action? Join Morpher, the revolutionary trading platform that's changing the game with blockchain technology. Experience zero fees, infinite liquidity, and the freedom to trade a wide array of assets, from traditional stocks and Forex to cutting-edge markets like NFTs and sneakers. Whether you're looking to invest fractionally, short sell without interest fees, or leverage your trades up to 10x, Morpher offers a unique and flexible trading experience tailored to your needs. Plus, with the Morpher Wallet, you'll enjoy unmatched safety and control over your investments. Don't miss out on this innovative approach to trading. Sign Up and Get Your Free Sign Up Bonus today and start trading on a platform as advanced as your strategies!

Disclaimer: All investments involve risk, and the past performance of a security, industry, sector, market, financial product, trading strategy, or individual’s trading does not guarantee future results or returns. Investors are fully responsible for any investment decisions they make. Such decisions should be based solely on an evaluation of their financial circumstances, investment objectives, risk tolerance, and liquidity needs. This post does not constitute investment advice.

Painless trading for everyone
Hundreds of markets all in one place - Apple, Bitcoin, Gold, Watches, NFTs, Sneakers and so much more.
Painless trading for everyone
Hundreds of markets all in one place - Apple, Bitcoin, Gold, Watches, NFTs, Sneakers and so much more.