Forex trading offers individuals the opportunity to participate in the global currency market. With its potential for significant profits, forex trading has attracted many aspiring traders.
In this blog post, we will explore the potential benefits and risks associated with forex trading, providing you with valuable insights to make informed decisions as you venture into this dynamic and exciting market.
The Basics of the Forex Market
The forex market, also known as the foreign exchange market or FX market, is by far the largest and most liquid financial market in the world. It is a global marketplace where participants can buy, sell, and exchange currencies. The forex market is open 24 hours a day, five days a week, and is estimated to be worth over $5 trillion each day.
The forex market has many different types of users. Banks use the forex market to facilitate international trade and investment. Businesses use the forex market to hedge against currency risk. Investors use the forex market to speculate on currency movements. And individuals use the forex market to make international payments and to invest in currencies.
The forex market is a decentralized market, there is no central exchange where trading takes place. Instead, trading takes place over a network of electronic trading platforms. This allows participants to trade currencies from anywhere in the world at any time of day.
Forex Currency Pairs
Currencies are traded in pairs. For example, the exchange rate between the euro and the US dollar may be represented by the EUR/USD currency pair.
There are different types of currency pairs. For example, major currency pairs are the most traded currency pairs in the forex market. They are typically the most liquid and have the lowest spreads. Major currency pairs include:
EUR/USD (euro/US dollar)
USD/JPY (US dollar/Japanese yen)
GBP/USD (British pound/US dollar)
USD/CHF (US dollar/Swiss franc)
Minor currency pairs are traded less frequently than major currency pairs. Minor currency pairs include:
AUD/USD (Australian dollar/US dollar)
NZD/USD (New Zealand dollar/US dollar)
CAD/USD (Canadian dollar/US dollar)
GBP/EUR (British pound/euro)
Cross currency pairs are typically less liquid than major and minor currency pairs, but they can offer higher volatility and potential for profit. Cross currency pairs include:
EUR/GBP (euro/British pound)
EUR/CHF (euro/Swiss franc)
EUR/JPY (euro/Japanese yen)
GBP/CHF (British pound/Swiss franc)
The characteristics of a currency pair can vary depending on a number of factors, including:
The economic strength of the countries involved
The interest rates in the countries involved
Political stability in the countries involved
Speculation by traders
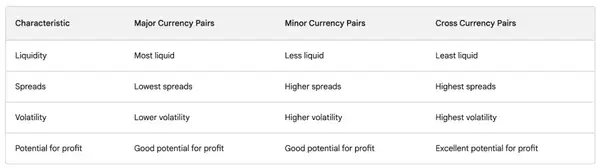
Understanding the characteristics of a currency pair will help traders make informed trading decisions. The table below summarizes important characteristics of these different types of currency pairs.
Forex Currency Pair Types
When choosing which currency pairs to trade, it is important to consider your trading goals and risk tolerance. For beginners, it may be best to start with major currency pairs. As you gain experience, you may want to consider trading minor and cross currency pairs. These pairs can offer higher volatility and potential for profit, but they are also more risky.
Factors Influencing Currency Exchange Rates
There are many factors influencing currency exchange rates.
Economic factors are one of the most important factors that can influence currency exchange rates. These include interest rates, inflation, economic growth, and employment.
Interest rates represent the cost of borrowing money. Borrowing money becomes more expensive as interest rates rise. This can lead to a decrease in economic activity, which causes currency values to fall.
The rate at which prices for goods and services rise is known as inflation. When inflation is high, it can make it harder to buy things. The currency's value may decline as a result of this.
The rate at which the economy is expanding is referred to as economic growth. When the economy is growing, it is a sign that the country is doing well. The currency's value may rise as a result of this growth.
Employment is the number of people who are working in a country. When unemployment is low, it is a sign that the economy is strong. This can cause the value of the currency to rise.
Political factors can also influence currency exchange rates. These factors include political stability, government policies, and wars.
Setting Up Your Trading Account
Before choosing a forex broker, you should research the following:
Make sure you understand the broker's fees, commissions, and other charges before you open an account.
Make sure the broker's trading platform is user-friendly and has the features you need.
Make sure the broker has good customer support in case you have any problems.
Consider Morpher: A Great Option for Forex Trading
Morpher is a unique trading platform that offers forex traders a number of benefits, including:
Morpher charges zero commissions on all trades.
Morpher offers some of the lowest spreads in the industry.
Morpher is open 24 hours a day, 7 days a week.
Morpher has no minimum deposit requirement.
Morpher's platform is easy to use and navigate.
Morpher offers a variety of educational resources to help you learn about forex trading.
Morpher is a secure platform that uses the latest security technologies to protect your data.
If you are looking for a forex trading platform that offers several benefits, Morpher is a great option. To learn more about Morpher and to open an account, visit https://www.morpher.com/.
Key Fundamental Concepts in Forex Trading
Here are some key fundamental concepts in forex trading.
Margin is the amount of money that you need to deposit in your trading account to open a position. Margin is typically a small percentage of the position's total value. For example, if you want to open a position worth $10,000, you may only need to deposit $1,000 in margin.
Leverage is the amount of borrowed money that you can use to amplify your trading power. Leverage allows you to control a larger position with a smaller amount of money. For example, if you have a 10:1 leverage ratio, you can control a position worth $10,000 with only $1,000 in margin.
It is important to understand the risks associated with margin and leverage before you start trading forex. Margin and leverage can magnify your profits, but they can also magnify your losses.
Common Forex Trading Terminologies and Tools
Here are some common forex trading terminologies and tools:
Stop-loss order: A stop-loss order is an order to sell a security once it reaches a certain price. This is used to limit losses on a trade.
Take-profit order: A take-profit order is an order to sell a security once it reaches a certain price. This is used to lock in profits on a trade.
Trailing stop: A trailing stop is a stop-loss order that moves with the price of the security. This is used to protect profits on a trade as the price moves in your favor.
Support: Support is a level of price where buyers are likely to step in and prevent the price from falling further.
Resistance: Resistance is a level of price where sellers are likely to step in and prevent the price from rising further.
Bollinger Bands: Bollinger Bands are a technical indicator that can be used to identify overbought and oversold conditions.
Moving averages: Moving averages are a technical indicator that can be used to identify trends.
Relative strength index (RSI): RSI is a technical indicator that can be used to identify overbought and oversold conditions.
Fundamental Analysis and Forex Trading
Fundamental analysis helps traders identify undervalued and overvalued currencies. By understanding the factors that affect currency values, traders can make better informed decisions about when to buy and sell currencies.
Some of the key factors considered in fundamental analysis include:
Economic data such as GDP growth, inflation, and unemployment can affect currency values. For instance, if a nation's GDP is increasing, the value of its currency is likely to increase as well.
Interest rates can also affect currency values. When interest rates rise, it becomes more expensive to borrow money, which can lead to a decrease in economic activity. This can cause the value of the currency to fall.
Political events such as wars, elections, and natural disasters can also affect currency values. For example, if there is a war in a country, it is likely that the currency will depreciate in value.
Further Resources
Here are some forex resources that new traders can seek out for further learning and education.
Trading plans help successful traders stay disciplined and guide traders in making informed decisions. Items that should be integrated into a comprehensive trading plan include:
Trading goals: What do you hope to achieve with your trading? Do you want to make a living from trading, or do you just want to make some extra money?
Risk management strategies: How much money are you willing to risk on each trade? What will you do if a trade goes against you?
Trading strategies: Are you a day trader, a swing trader, or a position trader? What time frames do you like to trade?
It is important to review your trading plan regularly and to make changes as needed. As you learn more about forex trading, you may need to adjust your goals, your risk management strategy, or your trading style.
Forex Trading Strategies
It is important to understand and explore various trading strategies to find the ones that suit your trading style and risk tolerance.
Day trading or intraday trading involves opening and closing positions within the same trading day, aiming to profit from intraday price fluctuations. Day traders primarily rely upon technical analysis, chart patterns, and indicators to identify short-term trends.
Swing trading aims to capture medium-term price movements that occur over a few days to a few weeks. Successful swing traders analyze both technical indicators and fundamental factors to identify trends and potential reversals. They typically use higher timeframes (e.g., 4-hour or daily charts) to make trading decisions.
Scalping is a high-frequency strategy that involves making numerous trades within short timeframes to capitalize on small price movements. Scalpers aim to take advantage of quick profits by entering and exiting positions swiftly. They typically target small price increments and rely on technical analysis indicators.
Trend following aims to identify and ride established price trends in the market. Traders using this approach typically rely on technical indicators like moving averages, trendlines, and price patterns to determine the direction of the trend.
Breakout trading involves identifying key support and resistance levels and taking positions when the price breaks out of these levels. Breakout traders anticipate that significant price movements will occur after a breakout, providing opportunities for profits.
Forex Trading Objectives and Risk Tolerance
Here's a guide to help define forex trading objectives and risk tolerance. Start by evaluating your financial circumstances. Consider your investment capital, income, expenses, and any financial commitments.
Next, define your trading goals:
Are you looking to generate a steady income or aiming for long-term wealth accumulation?
What is your desired return on investment (ROI)?
Are you trading as a primary source of income or as a part-time endeavor?
Then, assess the amount of time you can dedicate to forex trading. Align your trading objectives with the time you can realistically allocate to trading activities.
Defining your forex trading objectives and risk tolerance is a personal process that requires careful consideration. It sets the foundation for your trading journey and helps you make informed decisions while managing your risk effectively.
Technical Analysis and Charting
The idea that past price movements can be used to predict future price movements is the foundation of technical analysis. This is because the market is said to be cyclical, meaning that it moves in patterns that repeat themselves over time. By identifying these patterns, technical analysts believe they can predict where the market is headed and make profitable trades.
Technical analysis is a powerful tool that can be used to make profitable trades in forex markets. But technical analysis is not perfect. Therefore, it is important to use technical analysis in conjunction with other factors, such as fundamental analysis, to make informed trading decisions.
Common Technical Indicators and How to Interpret Them
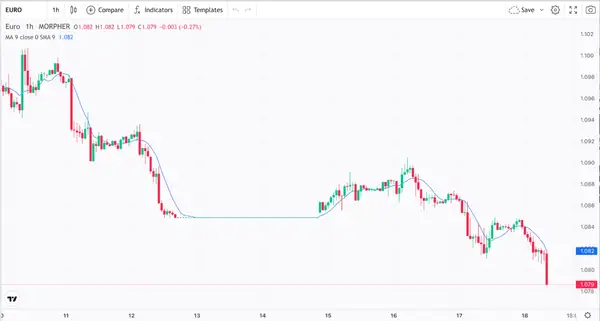
Moving averages are an effective way to identify trends. A moving average is a line that depicts the average price of a currency pair over a given time period and is plotted on a chart.
Moving Average and EUR/US Currency Pair (source: Morpher.com)
There are different moving averages that can be used, but the most popular are the simple moving average (SMA) and the exponential moving average (EMA). The SMA is calculated by adding up the closing prices of a currency pair over a specific period of time and dividing the total by the number of periods. The EMA is calculated in a similar way, but it gives more weight to recent prices.
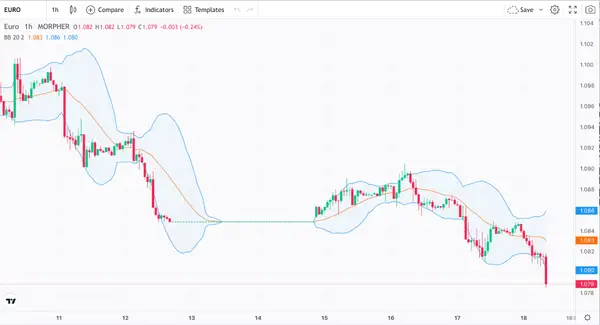
Overbought and oversold conditions can be identified with the help of bollinger bands, a volatility indicator. Bollinger bands are made up of three lines: a moving average, an upper band, and a lower band. The moving average is the middle band, and the upper and lower bands are calculated by adding and subtracting a standard deviation from the moving average.
Bollinger Bands and EUR/US Currency Pair (source: Morpher.com)
An overbought condition occurs when the price of a currency pair is above the upper band, and an oversold condition occurs when the price of a currency pair is below the lower band.
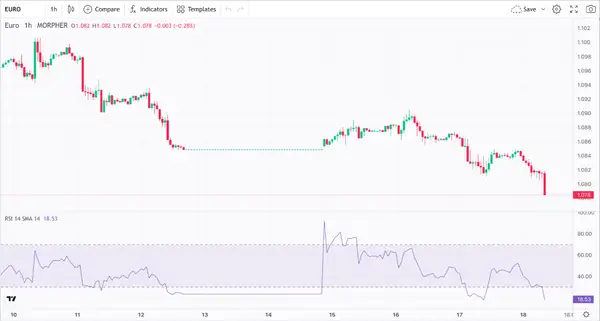
The relative strength index (RSI) is a momentum indicator that can be used to identify overbought and oversold conditions. The RSI is calculated by dividing the average of the up-closes by the average of the down-closes.
RSI and EUR/US Currency Pair (source: Morpher.com)
An overbought condition occurs when the RSI is above 70, and an oversold condition occurs when the RSI is below 30.
It is important to remember that technical indicators should not be relied upon exclusively. Rather, they should be used in conjunction with other factors, such as fundamental analysis, to make informed trading decisions.
Chart Patterns and Identifying Trade Setups
Chart patterns are formed by the price movement on a chart and provide insights into market sentiment and potential future price movements. Here are some common chart patterns and their significance to potential trade setups
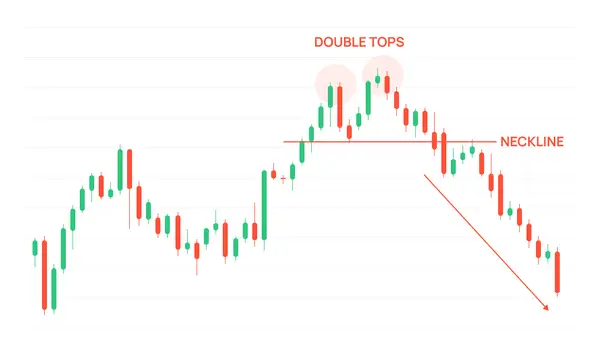
Double Top/Bottom: A double top pattern occurs when the price reaches a resistance or a neckline level twice, fails to break above it, and reverses downward.
Double Tops
Conversely, a double bottom pattern occurs when the price reaches a support level twice, fails to break below it, and reverses upward. These patterns indicate a potential reversal in the prevailing trend.
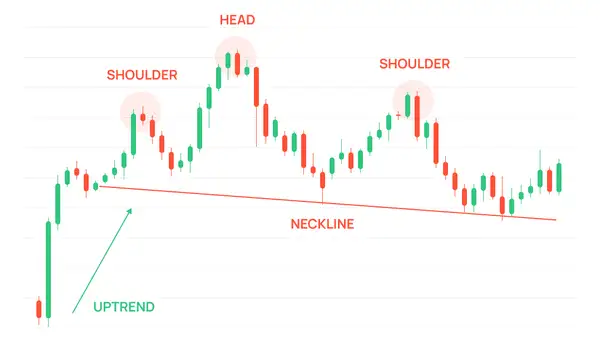
Head and Shoulders: The head and shoulders pattern consists of three peaks, with the middle peak (the head) being higher than the other two (the shoulders).
Head and Shoulders
Traders interpret this pattern as a potential bullish to bearish price reversion. The neckline, which connects the lows between the shoulders, acts as a crucial level of support. A break below the neckline confirms the pattern.
Head and shoulders patterns are considered reliable due to their symmetry and can provide entry and exit points for traders.
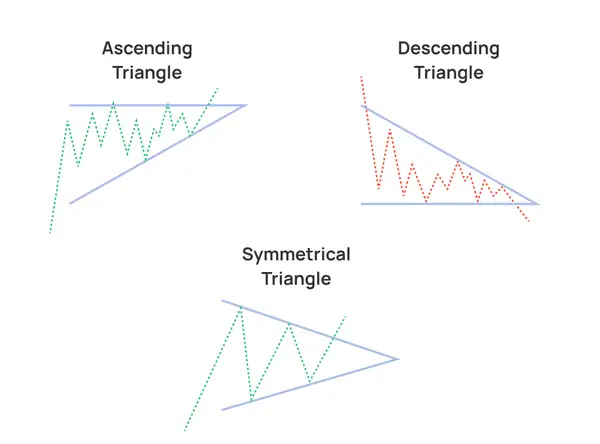
Triangle Patterns: Triangle patterns include ascending, descending, and symmetrical triangles. These patterns represent periods of consolidation and indecision in the market before a potential breakout occurs.
Triangle Patterns
As illustrated above, an ascending triangle pattern consists of a flat top resistance level and an upward-sloping support level, indicating potential bullish continuation. A descending triangle pattern has a flat bottom support level and a downward-sloping resistance level, suggesting potential bearish continuation. Symmetrical triangles have converging trendlines and represent a period of market indecision.
Traders often wait for a breakout above or below the triangle's trendlines to enter trades, along with confirmation from volume indicators.
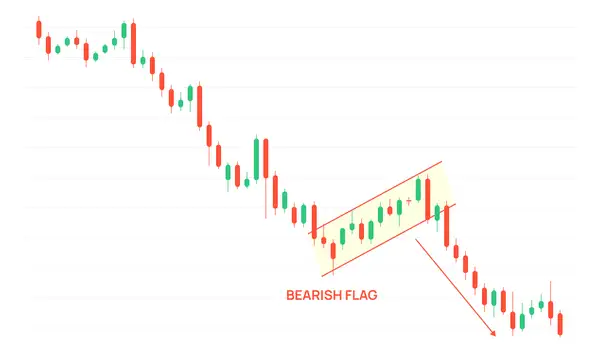
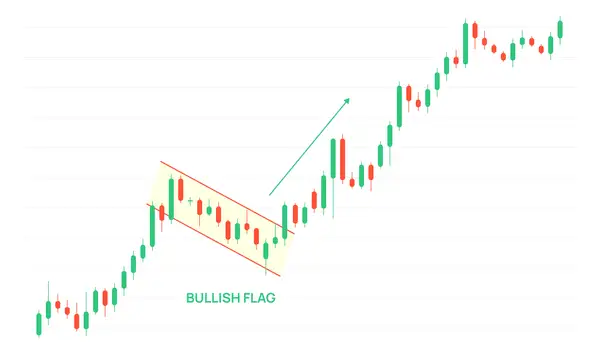
Flag and Pennant: Flag and pennant patterns are short-term continuation patterns that occur after a sharp price movement. Flags are rectangular patterns, while pennants are triangular patterns. Both patterns suggest a temporary pause or consolidation before the price resumes its previous trend, which can either be bearish or bullish.
Bearish and Bullish Flags
Traders often look for a breakout in the direction of the preceding trend and enter trades with appropriate risk management strategies.
Using Charts Effectively for Decision-Making
Here are some tips for traders to maximize the use of charts in their decision-making process:
Choose a chart type that suits your trading style and preferences. In forex trading, line charts, bar charts, and candlestick charts are the kinds of charts that are used most often.
Support levels are price levels where buying pressure typically outweighs selling pressure, causing the price to bounce back up. Resistance levels are price levels where selling pressure usually exceeds buying pressure, leading to price reversals or consolidations.
Traders use trendlines to get a feel for pricing momentum. An uptrend is formed by connecting the higher swing lows, while a downtrend is formed by connecting the lower swing highs.
Technical indicators are mathematical calculations that are based on data from the past regarding volume and price. They provide extra evidence of knowledge into market patterns, force, unpredictability, and overbought/oversold conditions.
Chart patterns can provide valuable trade signals. Learn to recognize and interpret common patterns like double tops/bottoms, head and shoulders, triangles, and flags. These patterns can offer insights into potential trend reversals, continuations, or breakout opportunities.
Analyze charts across multiple timeframes to gain a comprehensive view of the market. Long-term trends can be assessed on higher timeframes (daily, weekly), while short-term trading opportunities can be identified on lower timeframes (1-hour, 15-minute).
Risk Management and Money Management
Risk management involves implementing strategies and techniques to protect trading capital, preserve profits, and mitigate potential losses.
Here are several reasons why risk management is crucial in forex trading:
By limiting the amount of capital you risk per trade, you protect yourself from significant losses that could potentially wipe out your account.
By managing risk appropriately, you aim to achieve consistent and steady growth of your trading account over time. Consistent profitability, even if it's on a smaller scale, is more sustainable than sporadic large gains followed by substantial losses.
Effective risk management helps you control these emotions and make rational decisions. By setting predetermined stop-loss orders and profit targets, you remove the temptation to make impulsive, emotion-driven trades.
Risk-reward ratio refers to the potential reward you can gain in comparison to the amount of risk you are willing to take. A positive risk-reward ratio ensures that your potential profits outweigh potential losses.
Position sizing refers to the allocation of a specific portion of your trading capital to each trade based on the level of risk involved. By considering factors such as stop-loss distance, account size, and risk tolerance, you can adjust your position sizes to align with your risk management goals.
Diversification involves spreading trading capital across different currency pairs, timeframes, and trading strategies. By diversifying trades, the concentration risk associated with focusing on a single trade or currency pair is reduced.
Risk Management and Forex
It is important to manage risk in order to protect capital and avoid losses. Risk management techniques include:
Position sizing is the process of determining how much money you will risk on each trade. It is important to size your positions appropriately in order to manage risk.
Stop-loss orders are an important risk management tool because they limit potential losses. It is important to place a stop-loss order on every trade entered.
Take-profit orders help lock in profits and avoid letting profits run away. It is a good idea to place a take-profit order on every trade entered.
Diversification helps to reduce your risk if one asset loses value. It is a good idea to diversify your forex portfolio by trading different currency pairs.
Discipline is perhaps the most important risk management technique. It is important to believe in your trading plan and not let emotions get the best of you.
Money Management and Forex Trading
Money management involves managing risk and maximizing profits. There are a number of factors to consider when developing a money management strategy, including:
How much risk are you comfortable taking on?
With your forex trading, what do you hope to accomplish?
Are you a short-term or long-term trader?
Monitoring and Evaluating Your Trades
Monitoring open trades allows you to actively manage and make necessary adjustments to your positions.
By keeping a close eye on your positions, you can ensure that your risk parameters are maintained. You can assess whether the market is moving favorably or against your trade and make appropriate decisions to protect your capital. If necessary, you can adjust stop-loss levels or exit a trade entirely to limit potential losses.
Monitoring open trades also helps you manage trade psychology and emotions. By actively monitoring your trades, you can better control your emotions and avoid impulsive or irrational decisions based on fear or greed.
Monitoring open trades allows you to determine the optimal timing for trade exits and profit-taking. By observing the price movement and assessing market conditions, you can decide whether to close a trade partially or entirely to lock in profits.
Evaluating Trade Performance and Making Adjustments
The first step to evaluating trade performance involves tracking your trades to see what is working and what is not. There are a number of ways to track your trades, including using a trading journal or a trading platform.
Then, you need to analyze your results. This means looking at your win rate, your average profit, and your average loss. You also need to look at your risk-reward ratio.
Once you have analyzed your results, you need to identify your strengths and weaknesses. This will help you to focus on your strengths and improve your weaknesses.
Finally, you need to make adjustments to your trading plan. This may involve changing your trading strategy, your risk management, or your trading style.
Note that it takes time to become a successful trader. Don't expect to be profitable overnight. Just keep track of your trades, analyze your results, and make adjustments to your trading plan.
Trade Journaling for Learning and Improvement
Keeping a trade journal involves recording and analyzing your trading activities, including entry and exit points, trade rationale, and risk management parameters. It provides a systematic way to evaluate your trades, learn from past experiences, and make informed adjustments to your strategies.
Through trade journaling, you can develop a deeper understanding of your trading style, refine your decision-making process, and ultimately enhance your trading performance.
Conclusion
Forex trading can be a rewarding experience, but remember, it is not a get-rich-quick scheme. It takes time, patience, and continuous learning to become a successful forex trader. With time and experience, you can navigate the complexities of the forex market and unlock the potential for long-term success.
Disclaimer: All investments involve risk, and the past performance of a security, industry, sector, market, financial product, trading strategy, or individual’s trading does not guarantee future results or returns. Investors are fully responsible for any investment decisions they make. Such decisions should be based solely on an evaluation of their financial circumstances, investment objectives, risk tolerance, and liquidity needs. This post does not constitute investment advice.
Painless trading for everyone
Hundreds of markets all in one place - Apple, Bitcoin, Gold, Watches, NFTs, Sneakers and so much more.
Painless trading for everyone
Hundreds of markets all in one place - Apple, Bitcoin, Gold, Watches, NFTs, Sneakers and so much more.
Subscribe now to our newsletter to get critical insights and analysis: