In trading, spotting key reversal points can make all the difference between a profitable trade and a missed opportunity. One reliable tool for this is the Swing Failure Pattern (SFP), a signal that often points to potential reversals when price fails to break through support or resistance levels.
Imagine you’re trading Bitcoin, and the price is hovering near a significant resistance level. Suddenly, it breaks above that level, sparking excitement among breakout traders. But instead of continuing higher, the price quickly reverses, dropping back below the resistance. Those traders who jumped in early are now trapped, and this is where the Swing Failure Pattern comes into play. By recognizing this reversal signal, you could position yourself for a profitable short trade while others are caught on the wrong side of the market.
In this guide, we’ll break down what the Swing Failure Pattern is, how it works, and—most importantly—how you can use it to capitalize on these reversal opportunities. Let’s dive in.
What is the Swing Failure Pattern?
At its core, the Swing Failure Pattern (SFP) is a market reversal signal that occurs when the price breaks through a previous high or low, often luring in breakout traders, only to quickly reverse and trap those traders. This pattern is particularly useful in volatile markets where false breakouts happen frequently, and traders need an edge to avoid getting caught.
Picture this: You're watching a stock near a key support level. The price breaks below that level, which typically signals a further decline. However, instead of continuing downward, the price bounces back above the support level, signaling a potential reversal. This is a classic Swing Failure Pattern—where the initial breakdown fails, and the market reverses.
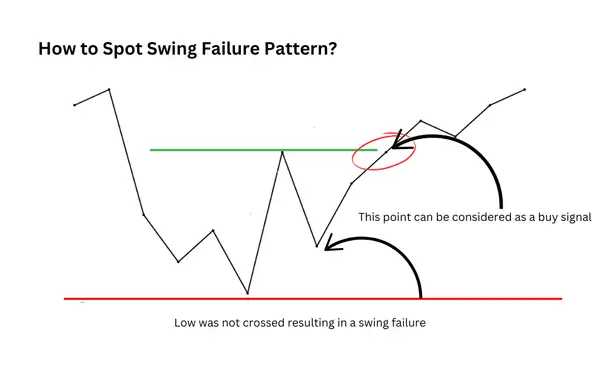
Key Elements of the Swing Failure Pattern: Break of Previous High/Low: Price breaches the prior high or low, attracting breakout traders. Quick Rejection: The breakout fails, and the price closes back below/above the breakout level. Price Reversal: The market then reverses in the opposite direction of the failed breakout, trapping traders who entered too soon.
Why Swing Failure Patterns Work
The magic behind SFPs lies in the psychology of the market. Breakout traders are often eager to jump in when they see a new high or low being breached. However, not every breakout follows through. When the market quickly reverses, it forces those traders to exit their positions, creating momentum in the opposite direction.
For example, in a bullish swing failure, breakout traders who went long above the resistance level are forced to sell as the price drops back below, fueling the reversal further. By spotting these traps, you can position yourself to profit from the unwinding of these breakout trades.
How to Identify a Swing Failure Pattern (Step-by-Step)
Identifying an SFP in real time requires discipline and an understanding of market structure. Here’s a practical, step-by-step approach to help you spot these patterns:
Find Key Levels of Support or Resistance: Start by identifying a significant swing high or low. These are critical levels where the price has historically reversed or paused.
Wait for the Breakout: Be patient, let the price break through the previous high or low. This breakout often attracts traders who expect further momentum in the same direction.
Look for Rejection: After the breakout, watch for a quick rejection. The price should close back within the original range, showing that the breakout has failed.
Confirmation: For extra confirmation, wait for another candle to close back within the previous range. This solidifies the idea that the breakout has failed, and a reversal is likely underway.
Entry Point: Enter your trade as the reversal gains momentum. For a failed breakout above resistance, you could enter a short trade. For a failed breakdown below support, look for a long trade opportunity.
Example: Let’s say Ethereum is testing a major resistance level at $1,800. The price spikes above it, hitting $1,820, but quickly reverses and closes below $1,800 on the same 4-hour candle. This is your swing failure signal. You enter a short trade when the next candle confirms the rejection, placing your stop-loss above the $1,820 level. As the price declines, you can capture the reversal, turning the failed breakout into a profit.
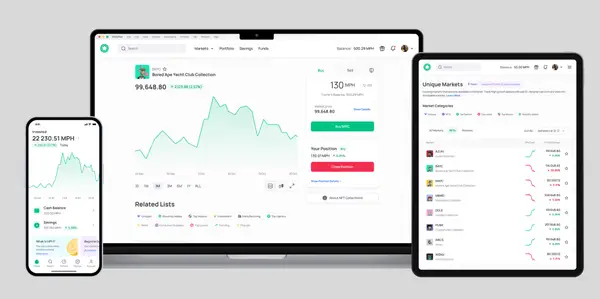
Ready to put the Swing Failure Pattern to work? Morpher offers advanced charting tools powered by TradingView, allowing you to apply multiple technical indicators. Freely mark your charts, analyze key levels, and make informed decisions based on solid technical foundations. Try Morpher today!
Bullish vs. Bearish Swing Failure Patterns
Understanding the difference between bullish and bearish Swing Failure Patterns is key to effectively using this tool in different market conditions.
Bullish Swing Failure Pattern
A bullish swing failure pattern occurs when the price briefly breaks below a significant support level but quickly reverses, closing back above that level. This pattern suggests that selling pressure has failed to push the market lower, signaling a potential reversal to the upside.
Key Characteristics:
The price dips below a previous swing low.
After breaking below, the price quickly reverses and closes back above the support level.
This pattern often traps traders who entered short positions, expecting a continued move lower.
Example:Bitcoin drops below a key support level of $40,000, reaching $39,500 before bouncing back and closing above $40,000. This swing failure pattern indicates a possible upward reversal.
Bearish Swing Failure Pattern
A bearish swing failure pattern is the opposite. It happens when the price briefly breaks above a key resistance level but fails to sustain the breakout, reversing and closing back below the level. This suggests that the buying pressure was not strong enough to push the price higher, and a potential downside reversal may follow.
Key Characteristics:
The price spikes above a previous swing high.
After breaking above resistance, the price quickly reverses and closes back below the resistance level.
Traders who went long on the breakout get trapped, leading to more selling pressure as they exit their positions.
Example:Ethereum pushes above a resistance level of $1,800, hitting $1,820 before reversing and closing below $1,800. This signals a potential downward movement, creating a short opportunity.
Swing Failure vs. Non-Failure Swing Patterns
Now that you understand swing failure patterns, it's also important to distinguish between swing failure patterns and non-failure swing patterns, which can look similar at first glance but have different implications.
Swing Failure Pattern
In a swing failure pattern, the price breaks a key level (support or resistance), but that break is not sustained. Instead, the price quickly reverses and moves in the opposite direction. This is why it's called a “failure”—the breakout attempt fails to follow through, trapping traders.
Key takeaway: A swing failure pattern often signals a reversal, offering an opportunity to trade against the failed breakout.
Non-Failure Swing Pattern
In a non-failure swing pattern, the price successfully breaks through a swing high or low and continues in the direction of the breakout. These patterns suggest that the breakout is valid, and the market may continue moving in that direction.
Example: If a stock breaks above a resistance level at $50 and keeps moving up to $55, that’s a non-failure swing pattern—indicating that the breakout was successful and confirming the continuation of the trend.
Key takeaway: Non-failure swings typically signal trend continuation, while swing failure patterns indicate potential reversals.
Best Trading Strategies for Leveraging Swing Failure Patterns
Swing Failure Patterns are versatile and can fit into various trading strategies, depending on your trading style and risk tolerance. Whether you're an intraday trader looking for quick reversals or a swing trader aiming to capture longer-term moves, SFPs can be a reliable tool in your arsenal. Let’s explore how to use them in different contexts.
Intraday Trading with SFPs
For intraday traders, Swing Failure Patterns provide excellent opportunities to capture quick reversals near key levels. On shorter timeframes, such as the 15-minute or 1-hour charts, SFPs often form around areas of strong support or resistance where traders expect significant reactions.
Example Strategy:
Setup: You're watching a stock that has been bouncing between $50 and $55. The price breaks above $55 but quickly reverses, closing back below $55 on the 15-minute chart. Action: You could enter a short trade once the rejection is confirmed, placing your stop-loss slightly above the recent high. Since intraday trades move quickly, you would aim for a short-term profit target, perhaps at the $53 level. Risk Management: Keep stop-losses tight in intraday setups, as volatility can lead to fast-moving markets. A 1:1 or 2:1 reward-to-risk ratio is usually ideal for this style of trading.
Swing Trading with SFPs
If you prefer swing trading, SFPs are equally effective on higher timeframes like the daily or 4-hour charts. In this approach, you’ll aim to capture bigger moves that play out over several days or even weeks.
Example Strategy:
Setup: A major cryptocurrency like Bitcoin tests a key support level at $40,000. It briefly breaks below to $39,500 but closes the day back above $40,000. Action: You enter a long trade after the swing failure is confirmed, anticipating a reversal back toward the upper end of its range. Your target could be $42,000 or higher, depending on the broader market context. Risk Management: With swing trades, you can afford to give the trade more breathing room. Set your stop-loss just below the failed low (in this case, around $39,500). Swing trades typically offer higher reward-to-risk ratios, so targeting a 2:1 or 3:1 ratio makes sense.
Risk Management: Protecting Yourself from False Signals
Even though Swing Failure Patterns are powerful, they aren’t infallible. Market conditions, fakeouts, and sudden news events can all cause false signals. The key to leveraging SFPs effectively is solid risk management.
Key Tips for Risk Management:
Always use stop-losses: Place your stop just above the swing high (for short trades) or below the swing low (for long trades). This way, if the market doesn’t reverse as expected, your losses are limited.
Position sizing: Use proper position sizing to manage your risk on each trade. Risking no more than 1-2% of your total account per trade is a good rule of thumb.
Don’t force trades: Wait for proper confirmation. Entering too early, before the rejection is clear, often leads to being caught in a false breakout or breakdown.
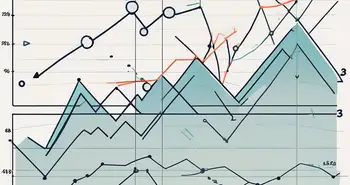
The Role of Volume and Price Action
In addition to understanding the anatomy of the Swing Failure Pattern, you must pay attention to volume and price action. These two factors provide valuable clues about market dynamics and can enhance the reliability of your analysis.
When delving deeper into the world of technical analysis, it becomes apparent that volume and price action are not merely peripheral elements but rather integral components that can significantly impact trading decisions. By incorporating a comprehensive analysis of both volume and price action, traders can gain a more nuanced understanding of market behavior and make more informed choices.
Interpreting Volume in Swing Failure Pattern
Volume plays a crucial role in confirming the validity of the Swing Failure Pattern. When volume is high during the failure swing, it suggests that market participants are actively participating in the reversal. High volume can add confidence to your analysis, indicating a higher probability of the pattern's success.
Furthermore, analyzing volume trends in conjunction with price movements can unveil hidden patterns and signals that may not be immediately apparent. By observing how volume fluctuates relative to price action, traders can identify potential shifts in market sentiment and anticipate future price movements with greater accuracy.
The Significance of Price Action
Price action refers to the movement of a security's price over time. When analyzing the Swing Failure Pattern, paying attention to price action is essential. Look for clear, decisive price movements during the failure swing. A strong and rapid reversal after a failed attempt to break a swing point can provide a powerful signal for traders.
Moreover, understanding the intricacies of price action involves more than just identifying patterns; it requires a deep dive into the underlying factors driving market movements. By studying price action in conjunction with other technical indicators, traders can develop a more comprehensive view of market dynamics and make well-informed trading decisions based on a holistic understanding of price behavior.
Common Mistakes and How to Avoid Them
Even the most experienced traders can fall prey to common mistakes when trading the Swing Failure Pattern. By being aware of these pitfalls, you can avoid them and improve your trading results.
Overtrading the Swing Failure Pattern
One common mistake is overtrading the Swing Failure Pattern. It's important to be selective and patient when identifying potential trades. Not every price swing or failure will warrant a trade. Focus on high-quality setups that align with your trading plan and strategy.
Ignoring Market Context
Another mistake traders make is ignoring market context. Always consider the broader market conditions, including trends, support and resistance levels, and any upcoming news or events that could impact the market. By acknowledging the market context, you can make more informed decisions when trading the Swing Failure Pattern.
FAQ: Recap of the Main Points
Q: What is the Swing Failure Pattern? A: The Swing Failure Pattern is a reversal pattern that occurs when a price fails to exceed a previous high or low point, indicating a potential shift in trend.
Q: How can I identify a Swing Failure Pattern? A: Look for a price attempt to break past a previous swing high or low that fails to do so, resulting in a reversal in the opposite direction.
Q: How can volume and price action enhance the Swing Failure Pattern analysis? A: High volume during the failure swing and strong price action after a failed attempt to break a swing point add confidence to the pattern's validity.
Q: What are some strategies for trading the Swing Failure Pattern? A: Timing your entry and exit based on confirmation signals and implementing proper risk management techniques are key strategies.
Q: What mistakes should I avoid when trading the Swing Failure Pattern? A: Overtrading the pattern and ignoring market context are common mistakes to avoid when trading the Swing Failure Pattern.
Now that you have gained a comprehensive understanding of the Swing Failure Pattern, its anatomy, and various trading strategies, it's time to put this knowledge into practice. Remember, successful trading requires practice, discipline, and continuous learning. Happy trading!
Discover the innovative world of Morpher, the trading platform that's revolutionizing investing with blockchain technology. With Morpher, you can trade a variety of asset classes, including stocks, cryptocurrencies, and more, all with zero fees and infinite liquidity. Embrace the power of fractional investing, short selling, and up to 10x leverage to maximize your trading strategies. Plus, enjoy the safety of the non-custodial Morpher Wallet. Don't miss out on this unique trading experience. Sign Up and Get Your Free Sign Up Bonus today and join the future of trading with Morpher.
Disclaimer: All investments involve risk, and the past performance of a security, industry, sector, market, financial product, trading strategy, or individual’s trading does not guarantee future results or returns. Investors are fully responsible for any investment decisions they make. Such decisions should be based solely on an evaluation of their financial circumstances, investment objectives, risk tolerance, and liquidity needs. This post does not constitute investment advice.
Painless trading for everyone
Hundreds of markets all in one place - Apple, Bitcoin, Gold, Watches, NFTs, Sneakers and so much more.
Painless trading for everyone
Hundreds of markets all in one place - Apple, Bitcoin, Gold, Watches, NFTs, Sneakers and so much more.
Subscribe now to our newsletter to get critical insights and analysis: